June 2020 Usage Statistics
eLearning workshops
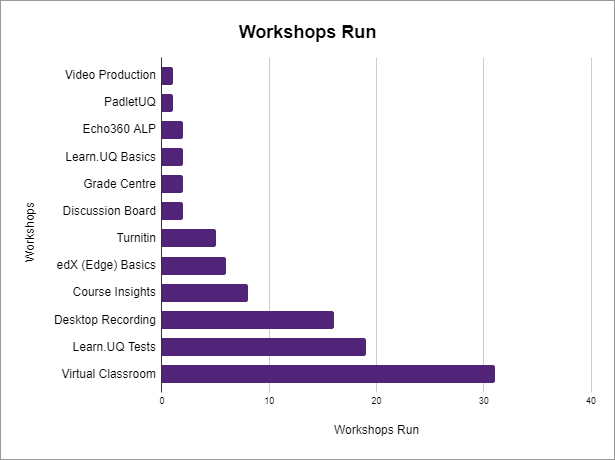
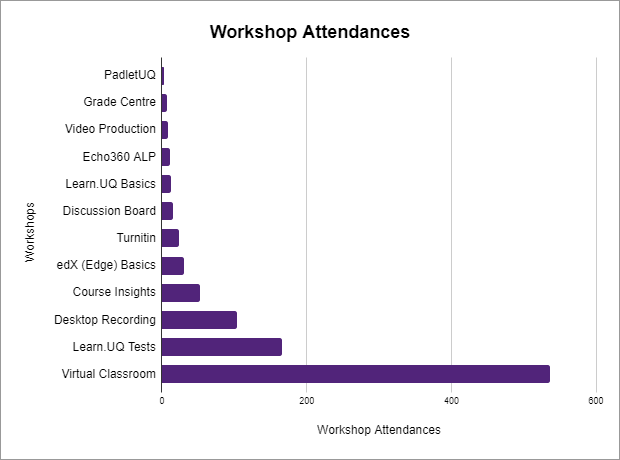
Workshops run and staff attendances
Practical, hands-on workshops in teaching and learning technologies are offered through Staff Development to help staff prepare their courses each semester. This year to date, 99 staff workshops have been run, with a total of 995 staff attendances. Since 2012, there has been a total of 6,715 staff workshop attendances.
Online workshop completions
| Workshop | Number of completions |
|---|---|
| Learn.UQ Basics | 18 |
| Learn.UQ Quizzes, Tests and Exams | 24 |
| Virtual Classroom (Zoom) | 109 |
| Desktop Recording (Kaltura Capture) | 12 |
| Video Assignment | 2 |
| Turnitin | 1 |
| Total | 166 |
Top 3 online workshops
Online workshops with the most page views from January - June 2020:
- Virtual Classroom (Zoom) online workshop - 7,376 page views
- Desktop Recording (Kaltura Capture) online workshop - 1,105 page views
- Learn.UQ Tests, Quizzes and Exams online workshop - 1,028 page views
eLearning guides
Guide updates
The following table displays the number of staff and student guides that have been created, updated and removed this year to date.
| Guides Created | Guides Updated | Guides Removed |
|---|---|---|
| 119 |
248 |
17 |
|
Total = 384 |
||
Top 10 eLearning guides
The following list includes the 10 most viewed eLearning guides this month:
- Create a Grade Schema (1-7 grades)
- Moving between Breakout Rooms
- Reactions in a Zoom meeting
- Polling in a Zoom meeting
- Tips for Using Zoom for Teaching
- Delete Threads and Edit/Delete Replies
- ECP
- Grade Centre
- Virtual Classroom Teaching and Learning Tips
- What is an ePortfolio?
Total webpage views this month = 36,460
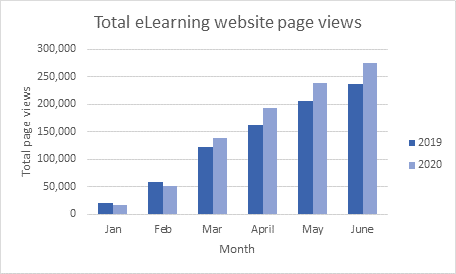
eLearning website page views
Total eLearning website page views from January – June 2019 vs 2020.
eLearning Solutions Service
The eLearning Solutions Service is designed to help staff implement the UQ eLearning tools that most successfully solve common teaching and learning problems. The eLearning Solutions Service to date in 2020 has catered for 251 Course Coordinators teaching into 301 courses and servicing a total of 40,007 student experiences across the university. The top three most common individual tools implemented are Online quiz / exam, Online marking / submission and Virtual Classroom - Zoom .
| Individual tools | Times implemented | Students benefitted |
|---|---|---|
| Active learning tool | 11 | 1967 |
| Collaboration / reflection tool | 16 | 3311 |
| eLearning refresher | 21 | 5038 |
| ePortfolio WIL - Chalk & Wire | 14 | 2114 |
| Grade Centre | 56 | 7968 |
| Group management | 18 | 2641 |
| Group Peer Assessment | 9 | 2653 |
| edX (Edge) | 9 | 1563 |
| Online marking / submission | 78 | 11862 |
| Online mini lecture | 25 | 2832 |
| Online quiz / exam | 86 | 16051 |
| Self Peer Assessment Tool | 0 | 0 |
| Course Insights | 4 | 836 |
| Video assignment | 17 | 1999 |
| Video content - Kaltura | 14 | 1436 |
| Video - Adobe Premiere Pro | 1 | 159 |
| Virtual classroom - Zoom | 69 | 11715 |
| Other | 2 | 297 |
Elearning Coaching Service Breakdown by School for Semester 1 - 2020
| By Faculty and School | Staff |
| BEL | 45 |
| Business | 40 |
| Law | 3 |
| Economics | 2 |
| EAIT | 14 |
| Architecture | 3 |
| Chemical Engineering | 2 |
| Civil Engineering | 3 |
| Information Technology and Electrical Engineering | 5 |
| Mechanical and Mining Engineering | 1 |
| HABS | 48 |
| Health and Rehabilitation Sciences | 6 |
| Dentistry | 3 |
| Human Movement and Nutrition Sciences | 9 |
| Nursing and Midwifery and Social Work | 17 |
| Pharmacy | 9 |
| Psychology | 4 |
| HASS | 38 |
| Communication and Arts | 10 |
| Education | 9 |
| Historical and Philosophical Inquiry | 3 |
| Languages and Cultures | 8 |
| Music | 1 |
| Political Science and International Studies | 4 |
| Social Science | 3 |
| Science | 51 |
| Agriculture and Food Sciences | 10 |
| Biological Sciences | 6 |
| Chemistry and Molecular Biosciences | 1 |
| Earth and Environmental Sciences | 14 |
| Mathematics and Physics | 5 |
| Veterinary Science | 15 |
| Medicine | 31 |
| Biomedical Sciences | 1 |
| Medicine | 7 |
| Public Health | 23 |
| Other | 8 |
ePortfolio usage
|
Usage in May |
Usage this year to date |
|---|---|
| Assessments: 5788 | 20223 |
| Files Uploaded: 2810 | 21520 |
|
Courses/programs deployed in Semester 1, 2020 |
Courses/programs under development |
Courses/programs completing their deployment review |
|---|---|---|
| HaBS Student Mentor and Leader Programs | Master of Pharmaceutical Industry Practice | |
| LAWS4701 | ||
| Master of Social Work | ||
| Bachelor of Social Work |
eLearning Support - Requests and Trends
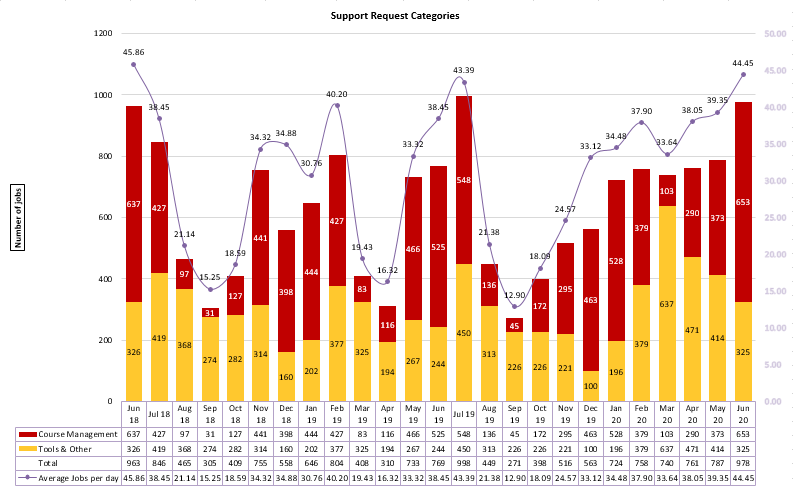
Download Support Request Categories-202006.csv
The number of jobs for June 2020 increased by 21.4% when compared to June 2019 and increased by 1.5% when compared to June 2018 and increased by 19.5% when compared to May 2020.
Course Management jobs for June 2020 increased by 19.6% when compared with June 2019 and increased by 2.5% when compared with June 2018 and increased by 42.9% when compared with May 2020.
Tools & Other jobs for June 2020 increased by 24.9% when compared with June 2019 yet decreased by 0.3% when compared with June 2018 and decreased by 21.5% when compared with May 2020.
The distribution of jobs were mostly through Course Management (66.77%) with Tools & Other (33.23%).
RESPONSE TO SUPPORT REQUESTS FLAGGED AS URGENT BY CLIENTS
There were nineteen Urgent jobs during June 2020. A breakdown of the Urgent jobs are as follows.
two of Blackboard Course Content, one of Blackboard Grade Centre, nine of Blackboard Tests, one of Course Request, one of Echo360, one of Kaltura, four of Turnitin.
All Urgent requests were responded to within an hour.