January 2023 Usage Statistics
eLearning workshops
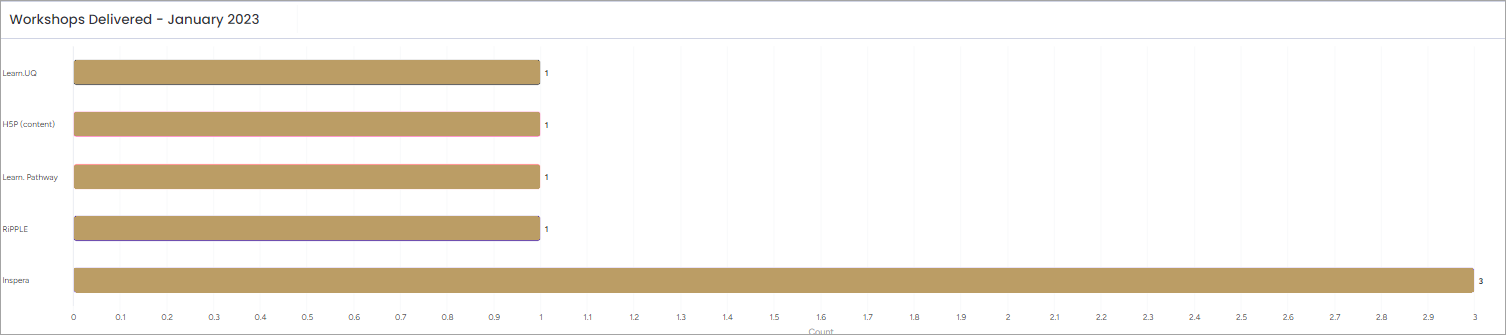
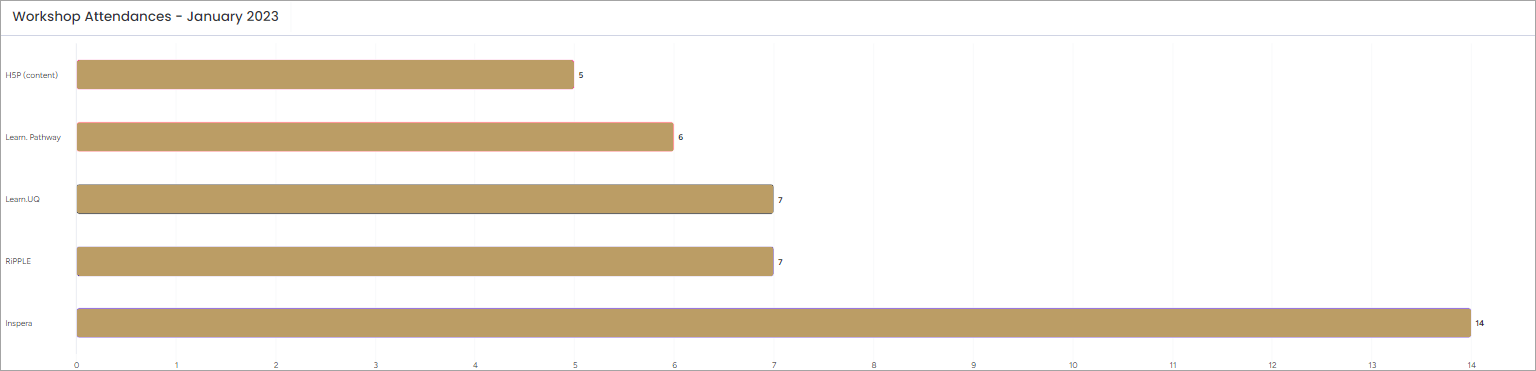
Workshops run and staff attendance
Practical, hands-on workshops in teaching and learning technologies are offered through Workday to help staff prepare their courses each semester. In January, 10 workshops were conducted with 55 participants attending. This year to date, 10 staff workshops have been run with a total of 55 attendances. Since 2012, there has been a total of 9,793 staff workshop attendances.
Self-paced workshop completions
| Workshop | Number of engagements | Number of completions |
|---|---|---|
| Learn.UQ Basics | 5 | 1 |
| Learn.UQ Quizzes, Tests and Exams | 2 | 0 |
| Virtual Classroom (Zoom) | 1 | 1 |
| Desktop Recording (Kaltura Capture) | 0 | 0 |
| Video Assignment | 0 | 0 |
| Turnitin | 4 | 1 |
| Grade Centre | 0 | 0 |
| LearnX / Edx (Edge) | 5 | 1 |
| Total | 17 | 4 |
eLearning guides
Guide updates
The following table displays the number of staff and student guides that have been created, updated and removed this year to date.
| Guides Created | Guides Updated | Guides Removed |
|---|---|---|
| 5 | 14 | 44 |
Total = 63 | ||
Top 10 eLearning guides
The following list includes the 10 most viewed eLearning guides this month:
Course Profile (655 views)
ePortfolio (487 views)
Discussion board threads (370 views)
Tests and pools (294 views)
Reactions in a Zoom meeting (288 views)
Create a Grade Schema (1-7 grades) (281 views)
Set Privacy and Share a Padlet (192 views)
Order SI-net Courses and UQ Extend Courses (187 views)
Save a Test as a PDF (187 views)
Course Requests (173 views)
Total webpage views: 19,841
Total webpage views for previous month (December 2022): 13,932
January YouTube views: 1,300
YouTube views for previous month (December 2022): 1,037
eLearning Adviser Consultations
In the month of January, eLearning advisers provided 29 appointments to help 22 course coordinators adopt eLearning technology in 28 courses. The eLearning Adviser Consultations to date in 2023 have catered for 22 Course Coordinators teaching into 28 courses which constitute approximately 0.81% of all courses in the university and servicing a total of 3755 student experiences across the university. In total, the number of appointments equals 29. The top three most common individual tools implemented are Online marking/submission, Grade Centre and Online quiz/exam.
| Individual tools | Times implemented | Students benefitted |
|---|---|---|
| Active learning tool | 1 | 250 |
| Authorship | 0 | 0 |
| Collaboration / reflection tool | 1 | 50 |
| eLearning refresher | 5 | 824 |
| ePortfolio WIL - Chalk & Wire | 2 | 180 |
| Grade Centre | 6 | 781 |
| Group management | 1 | 449 |
| Group Peer Assessment | 1 | 150 |
| H5P | 1 | 60 |
| Microsoft Teams | 0 | 0 |
| LearnX | 1 | 120 |
| Online marking / submission | 8 | 1380 |
| Online mini lecture | 1 | 449 |
| Online quiz / exam | 8 | 1690 |
| Self Peer Assessment Tool | 0 | 0 |
| Course Insights | 0 | 0 |
| Video assignment | 0 | 0 |
| Video content - Kaltura | 0 | 0 |
| Virtual classroom - Zoom | 2 | 305 |
| Other | 0 | 0 |
ePortfolio usage
Usage in January | Usage this year to date |
|---|---|
| Assessments: 514 | 514 |
| Files Uploaded: 769 | 769 |
eLearning Support - Requests and Trends
Download Support Request Categories-202301.csv
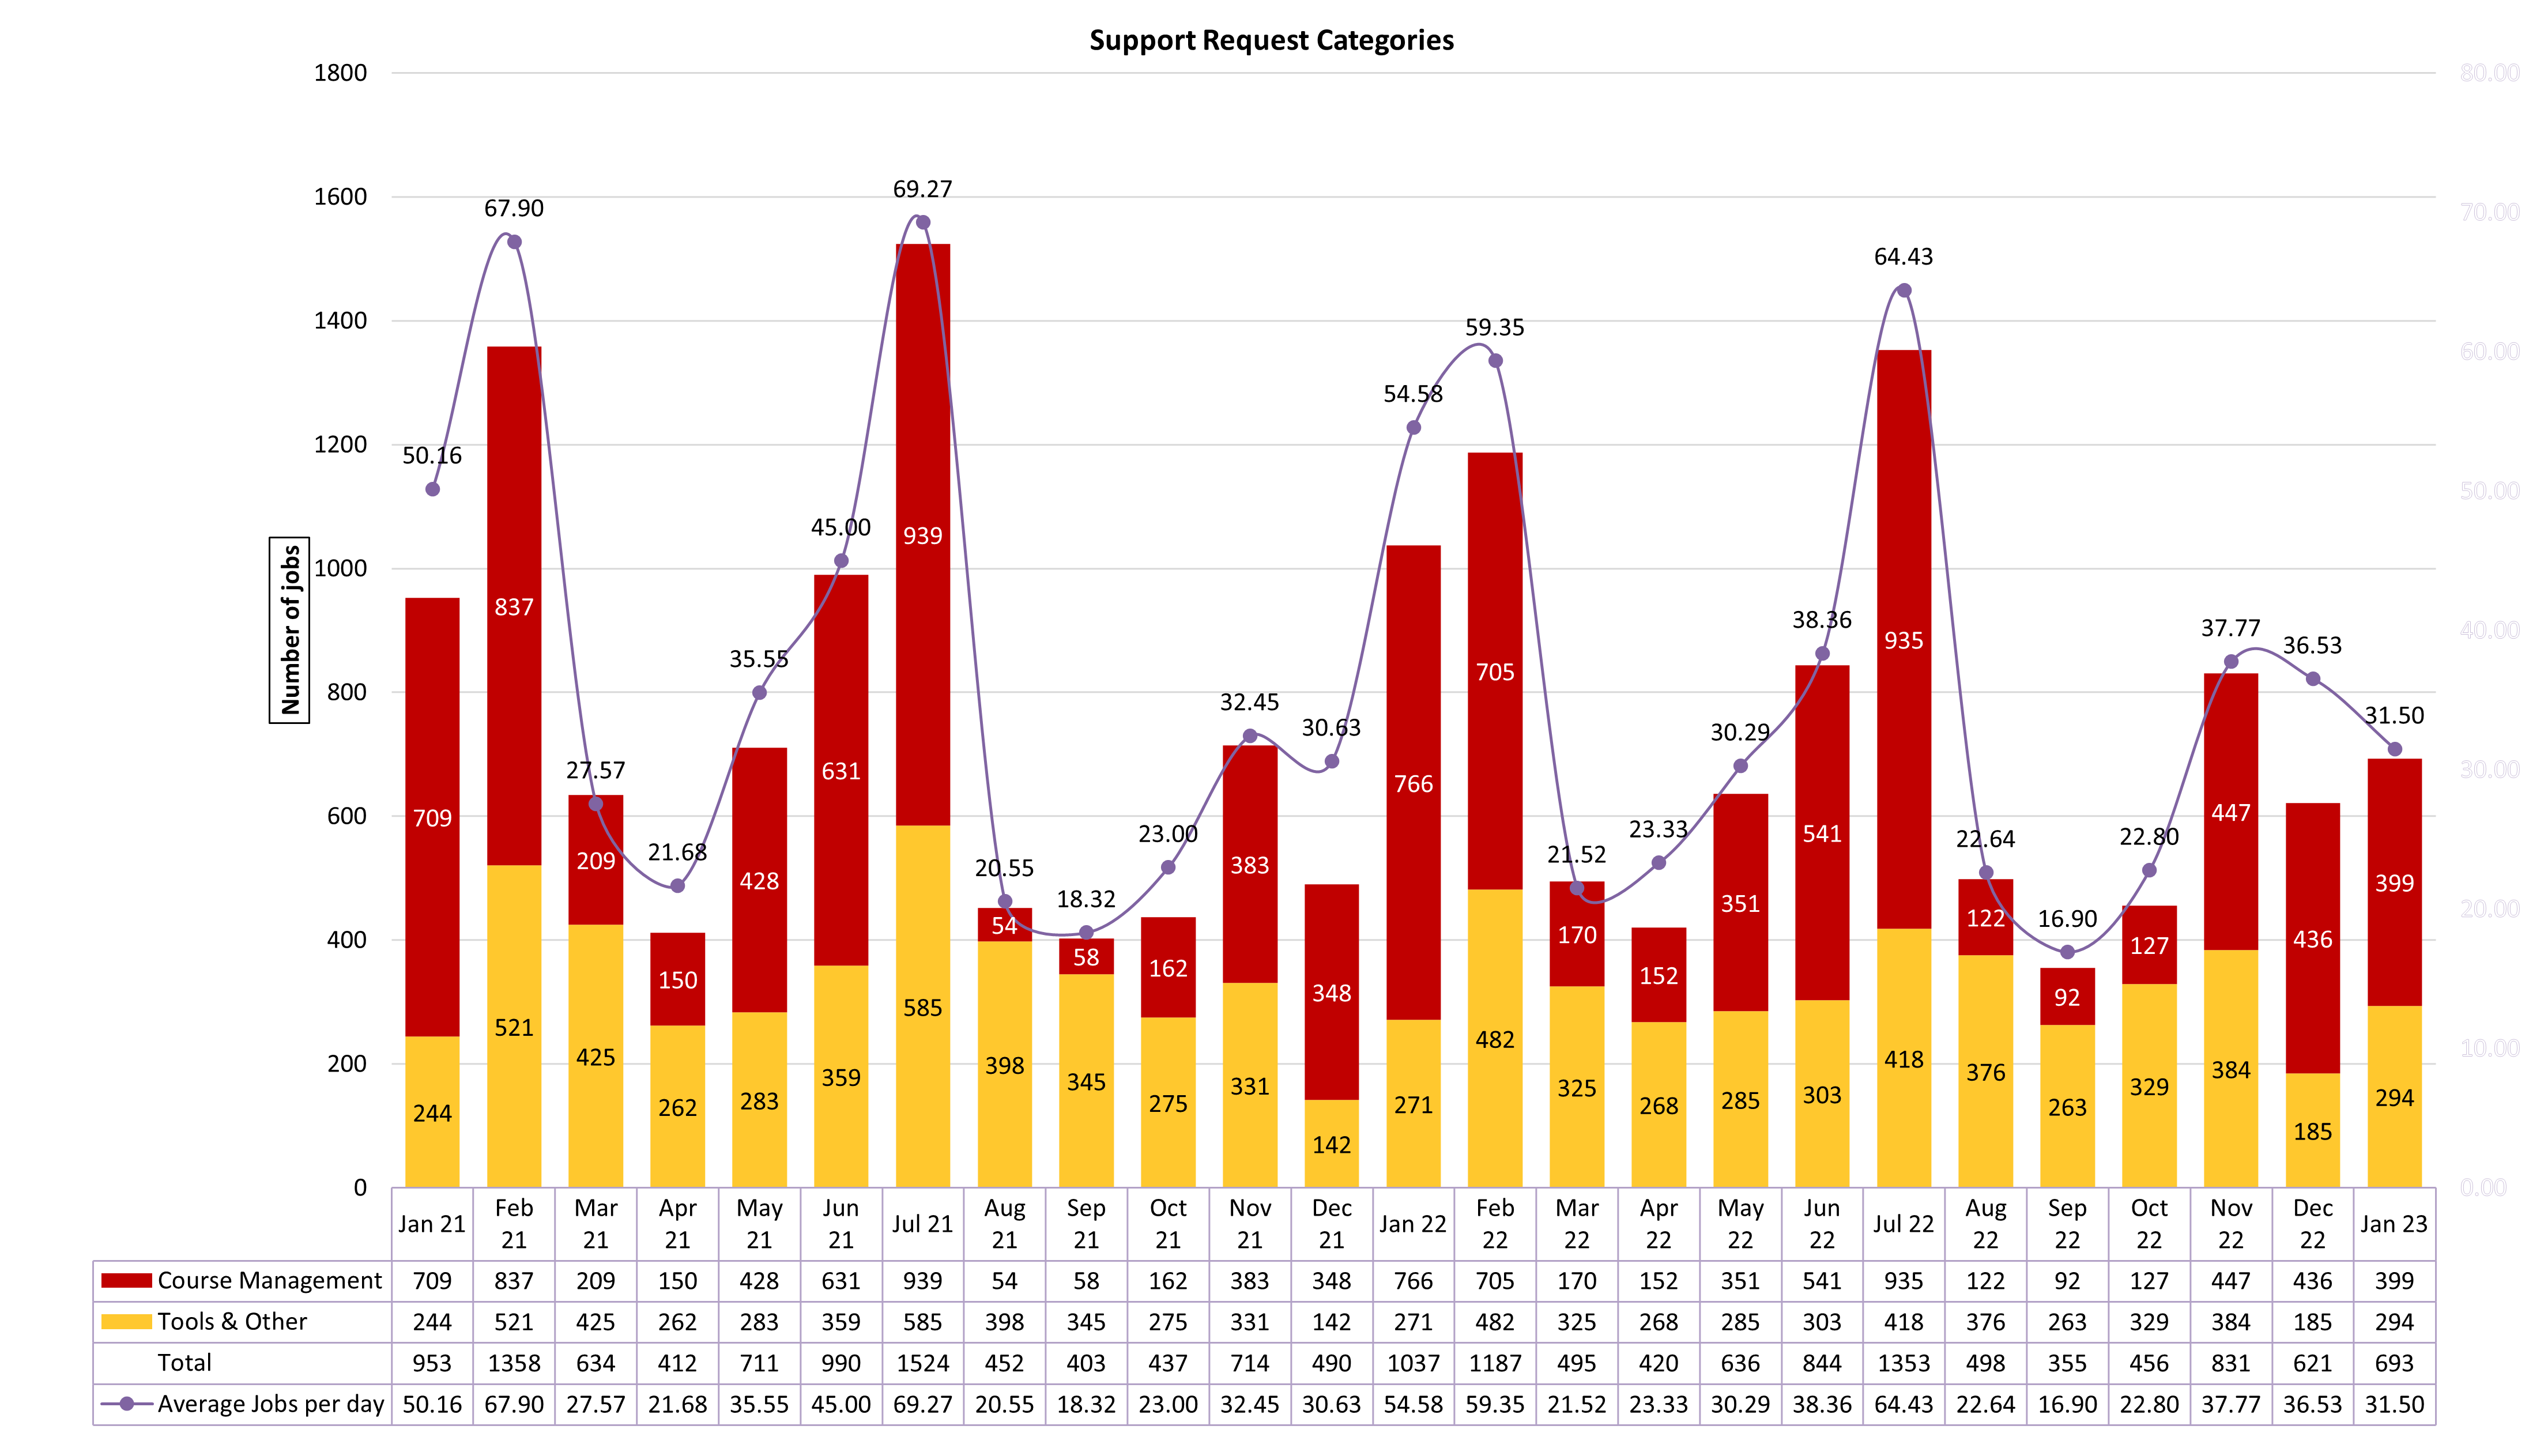
The number of jobs for January 2023 decreased by 33.2% when compared to January 2022 and decreased by 27.3% when compared to January 2021 yet increased by 10.4% when compared to December 2022.
Course Management jobs for January 2023 decreased by 47.9% when compared with January 2022 and decreased by 43.7% when compared with January 2021 and decreased by 8.5% when compared with December 2022.
Tools & Other jobs for January 2023 increased by 7.8% when compared with January 2022 and increased by 17% when compared with January 2021 and increased by 37.1% when compared with December 2022.
The distribution of jobs were mainly in favour of Course Management (57.58%) with Tools & Other (42.42%).
RESPONSE TO SUPPORT REQUESTS FLAGGED AS URGENT BY CLIENTS
During January 2023 there were five (5) Urgent jobs. A breakdown of the Urgent jobs are as follows.
Blackboard Population (2), Course Request (1), Exam related (1), H5P (1).
All Urgent requests were responded to within an hour.