February 2024 Usage Statistics
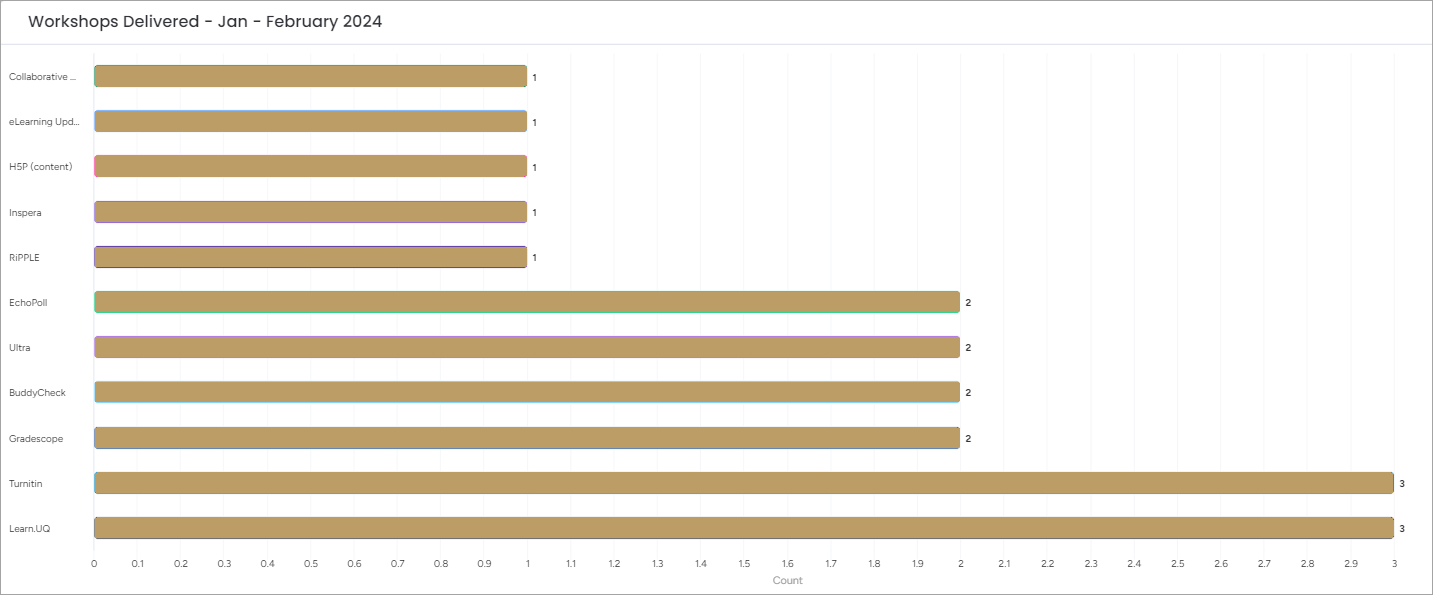
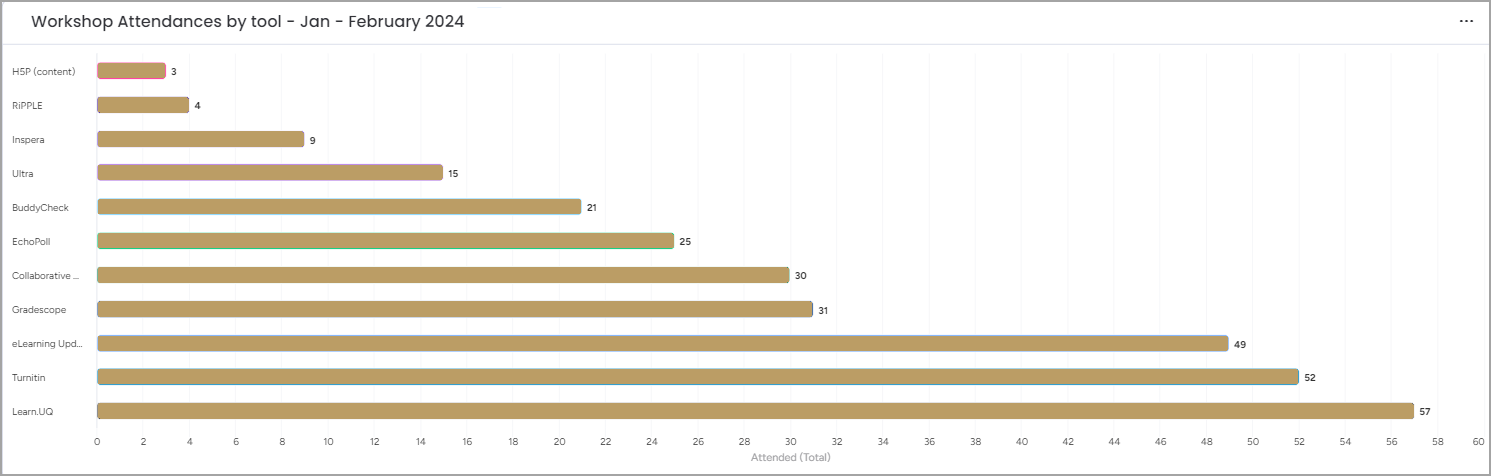
Workshops run and staff attendance
Practical, hands-on workshops in teaching and learning technologies are offered to help staff prepare their courses each semester. In February, 17 workshops were conducted with 321 participants attending. This year to date, 20 staff workshops have been run with a total of 337 attendances. Since 2012, there has been a total of 11,735 staff workshop attendances.
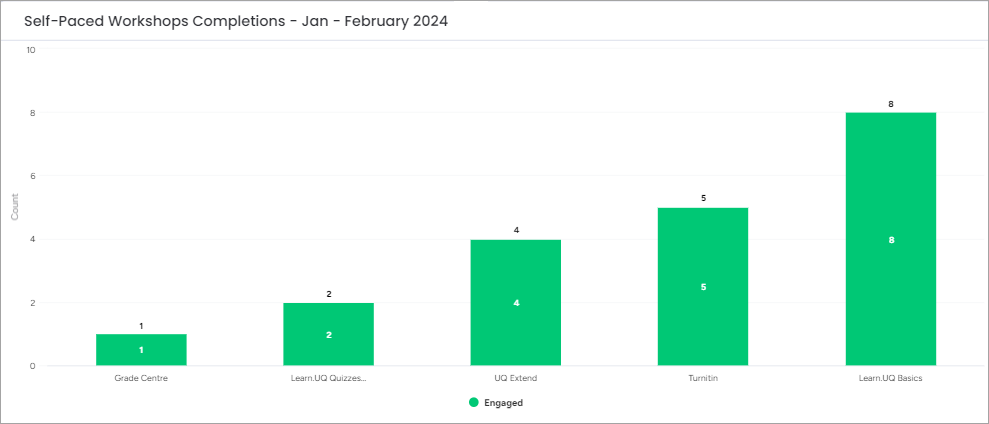
Self-paced workshop completions
eLearning guides
Displays the number of staff and student guides that have been created, updated and removed this year to date.
| Guides Created | Guides Updated | Guides Removed |
|---|---|---|
| 18 | 11 | 0 |
Total = 29 | ||
Top 10 eLearning guides
The following list includes the 10 most viewed eLearning guides this month:
- UQ Extend course content links in Learn.UQ (Blackboard) (1190 views)
- What is an ePortfolio? (773 views)
- Course Profile (588 views)
- Getting Started with PadletUQ (545 views)
- Create a Grade Schema (1-7 grades) (494 views)
- Learn.UQ Welcome Page (478 views)
- UQwordcloud - UQ Active Learn (449 views)
- UQpoll - UQ (383 views)
- Getting started (362 views)
- EchoPoll (346 views)
Total webpage views: 43,360
Total webpage views for the previous month (January 2024): 21,522
February YouTube views: 2,043
YouTube views for preview month (January 2024): 1,068
eLearning Adviser Consultations
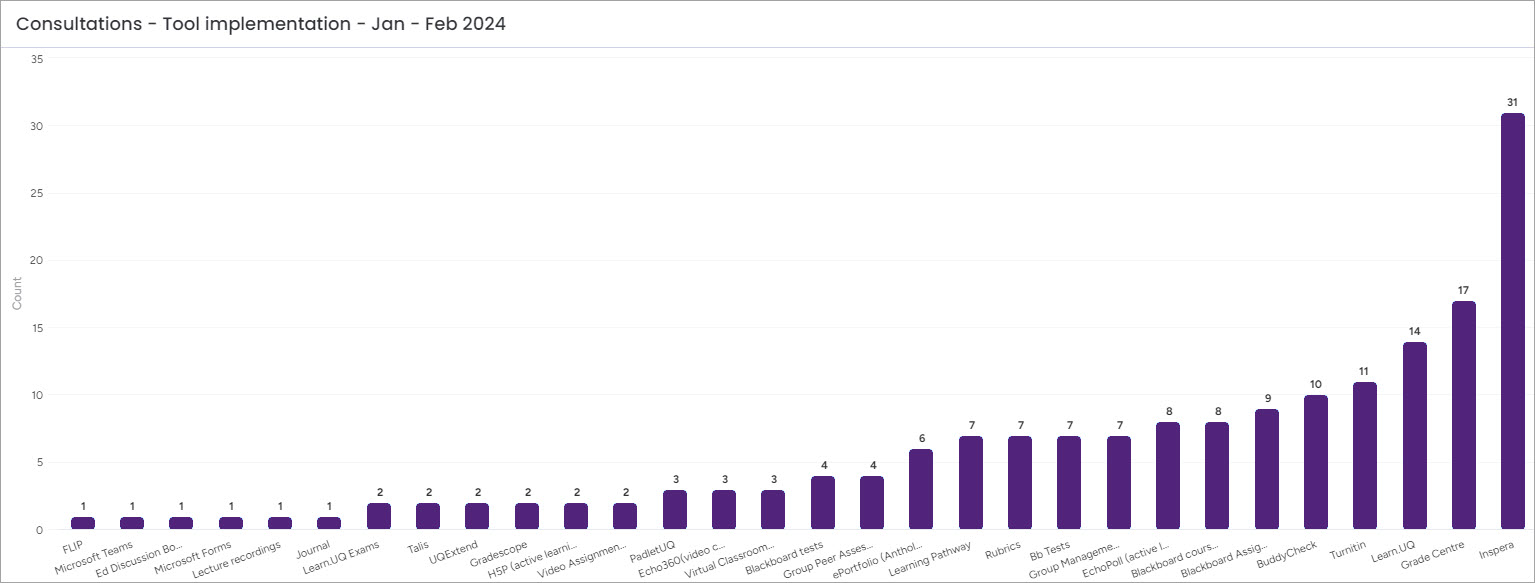
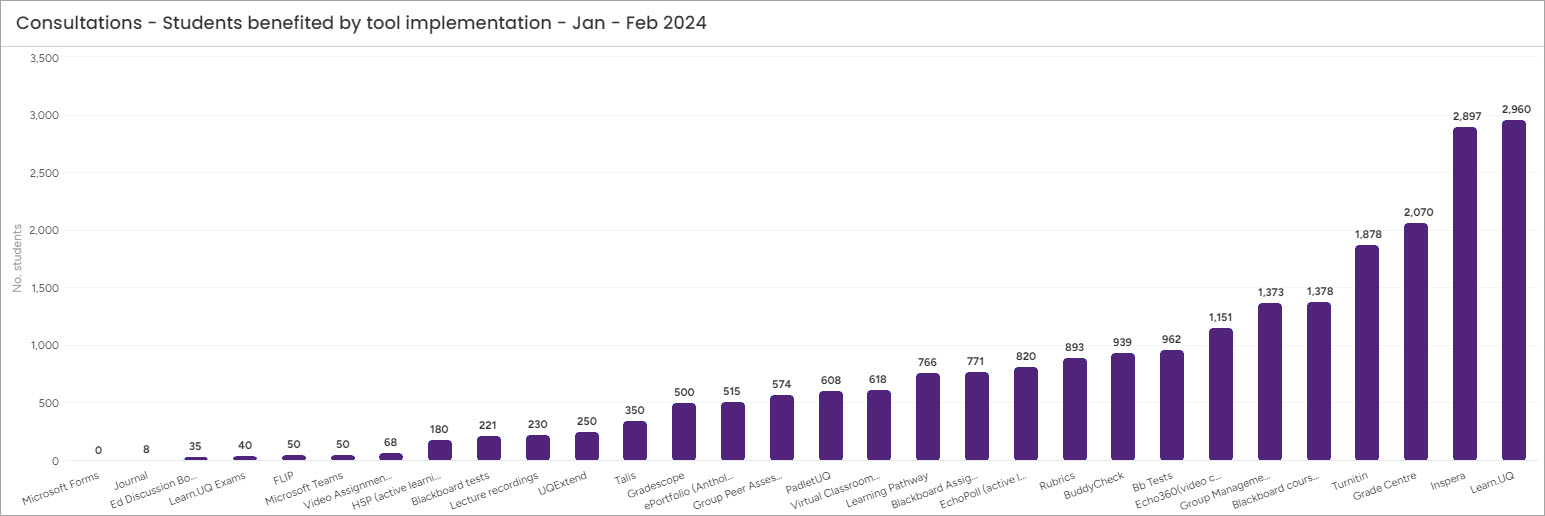
In February, eLearning advisers provided 86 appointments to help courses adopt eLearning technology. The eLearning Adviser Consultations to date in 2024 have catered for 89 Course Coordinators teaching into 107 courses which constitute approximately 2.9% of all courses in the university and servicing a total of 11,549 student experiences across the university. In total, the number of appointments equals 127. The top three most common individual tools implemented are Online quiz/exam (Inspera), Grade Centre, and Learn.UQ.
Individual tools - Time implemented
Individual tools - Student benefited
ePortfolio usage
Usage in February | Usage this year to date |
|---|---|
| Assessments: 903 | 1513 |
| Files Uploaded: 2168 | 3116 |
eLearning Support - Requests and Trends
Download Support Request Categories-202402.csv
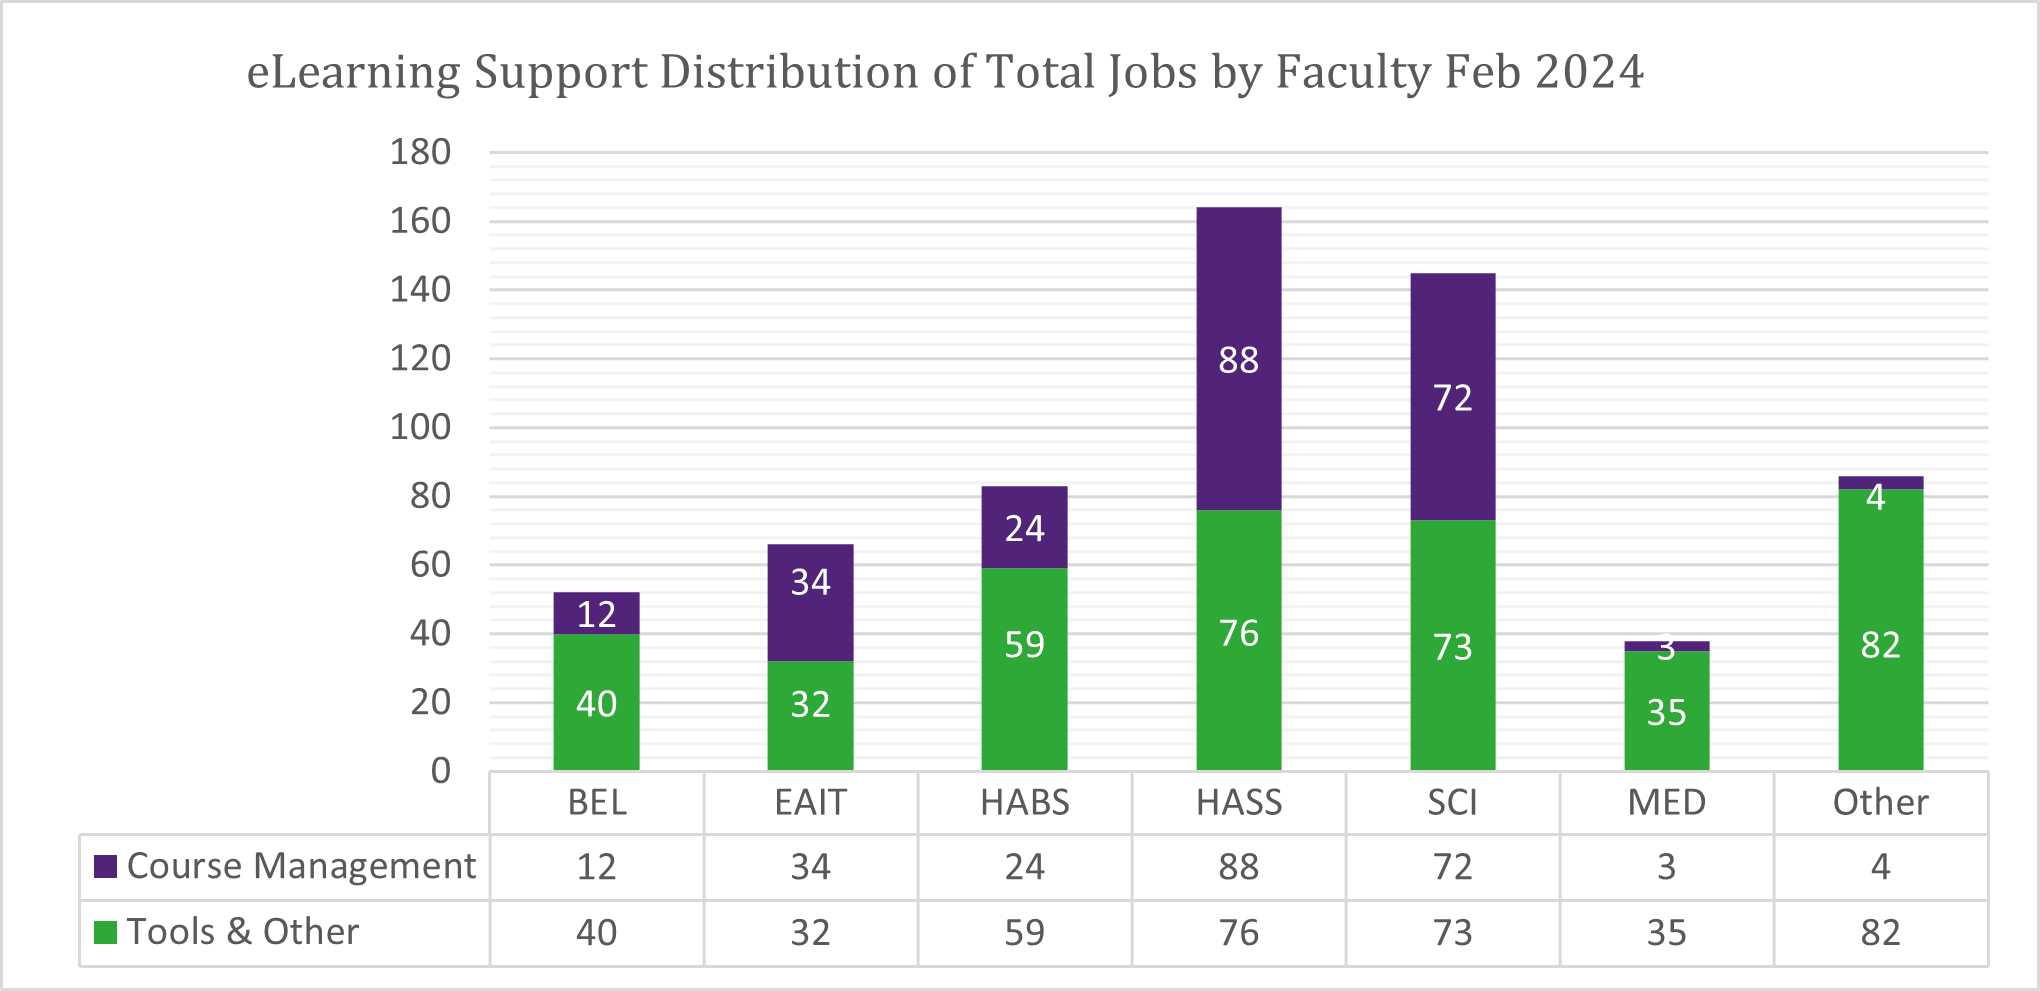
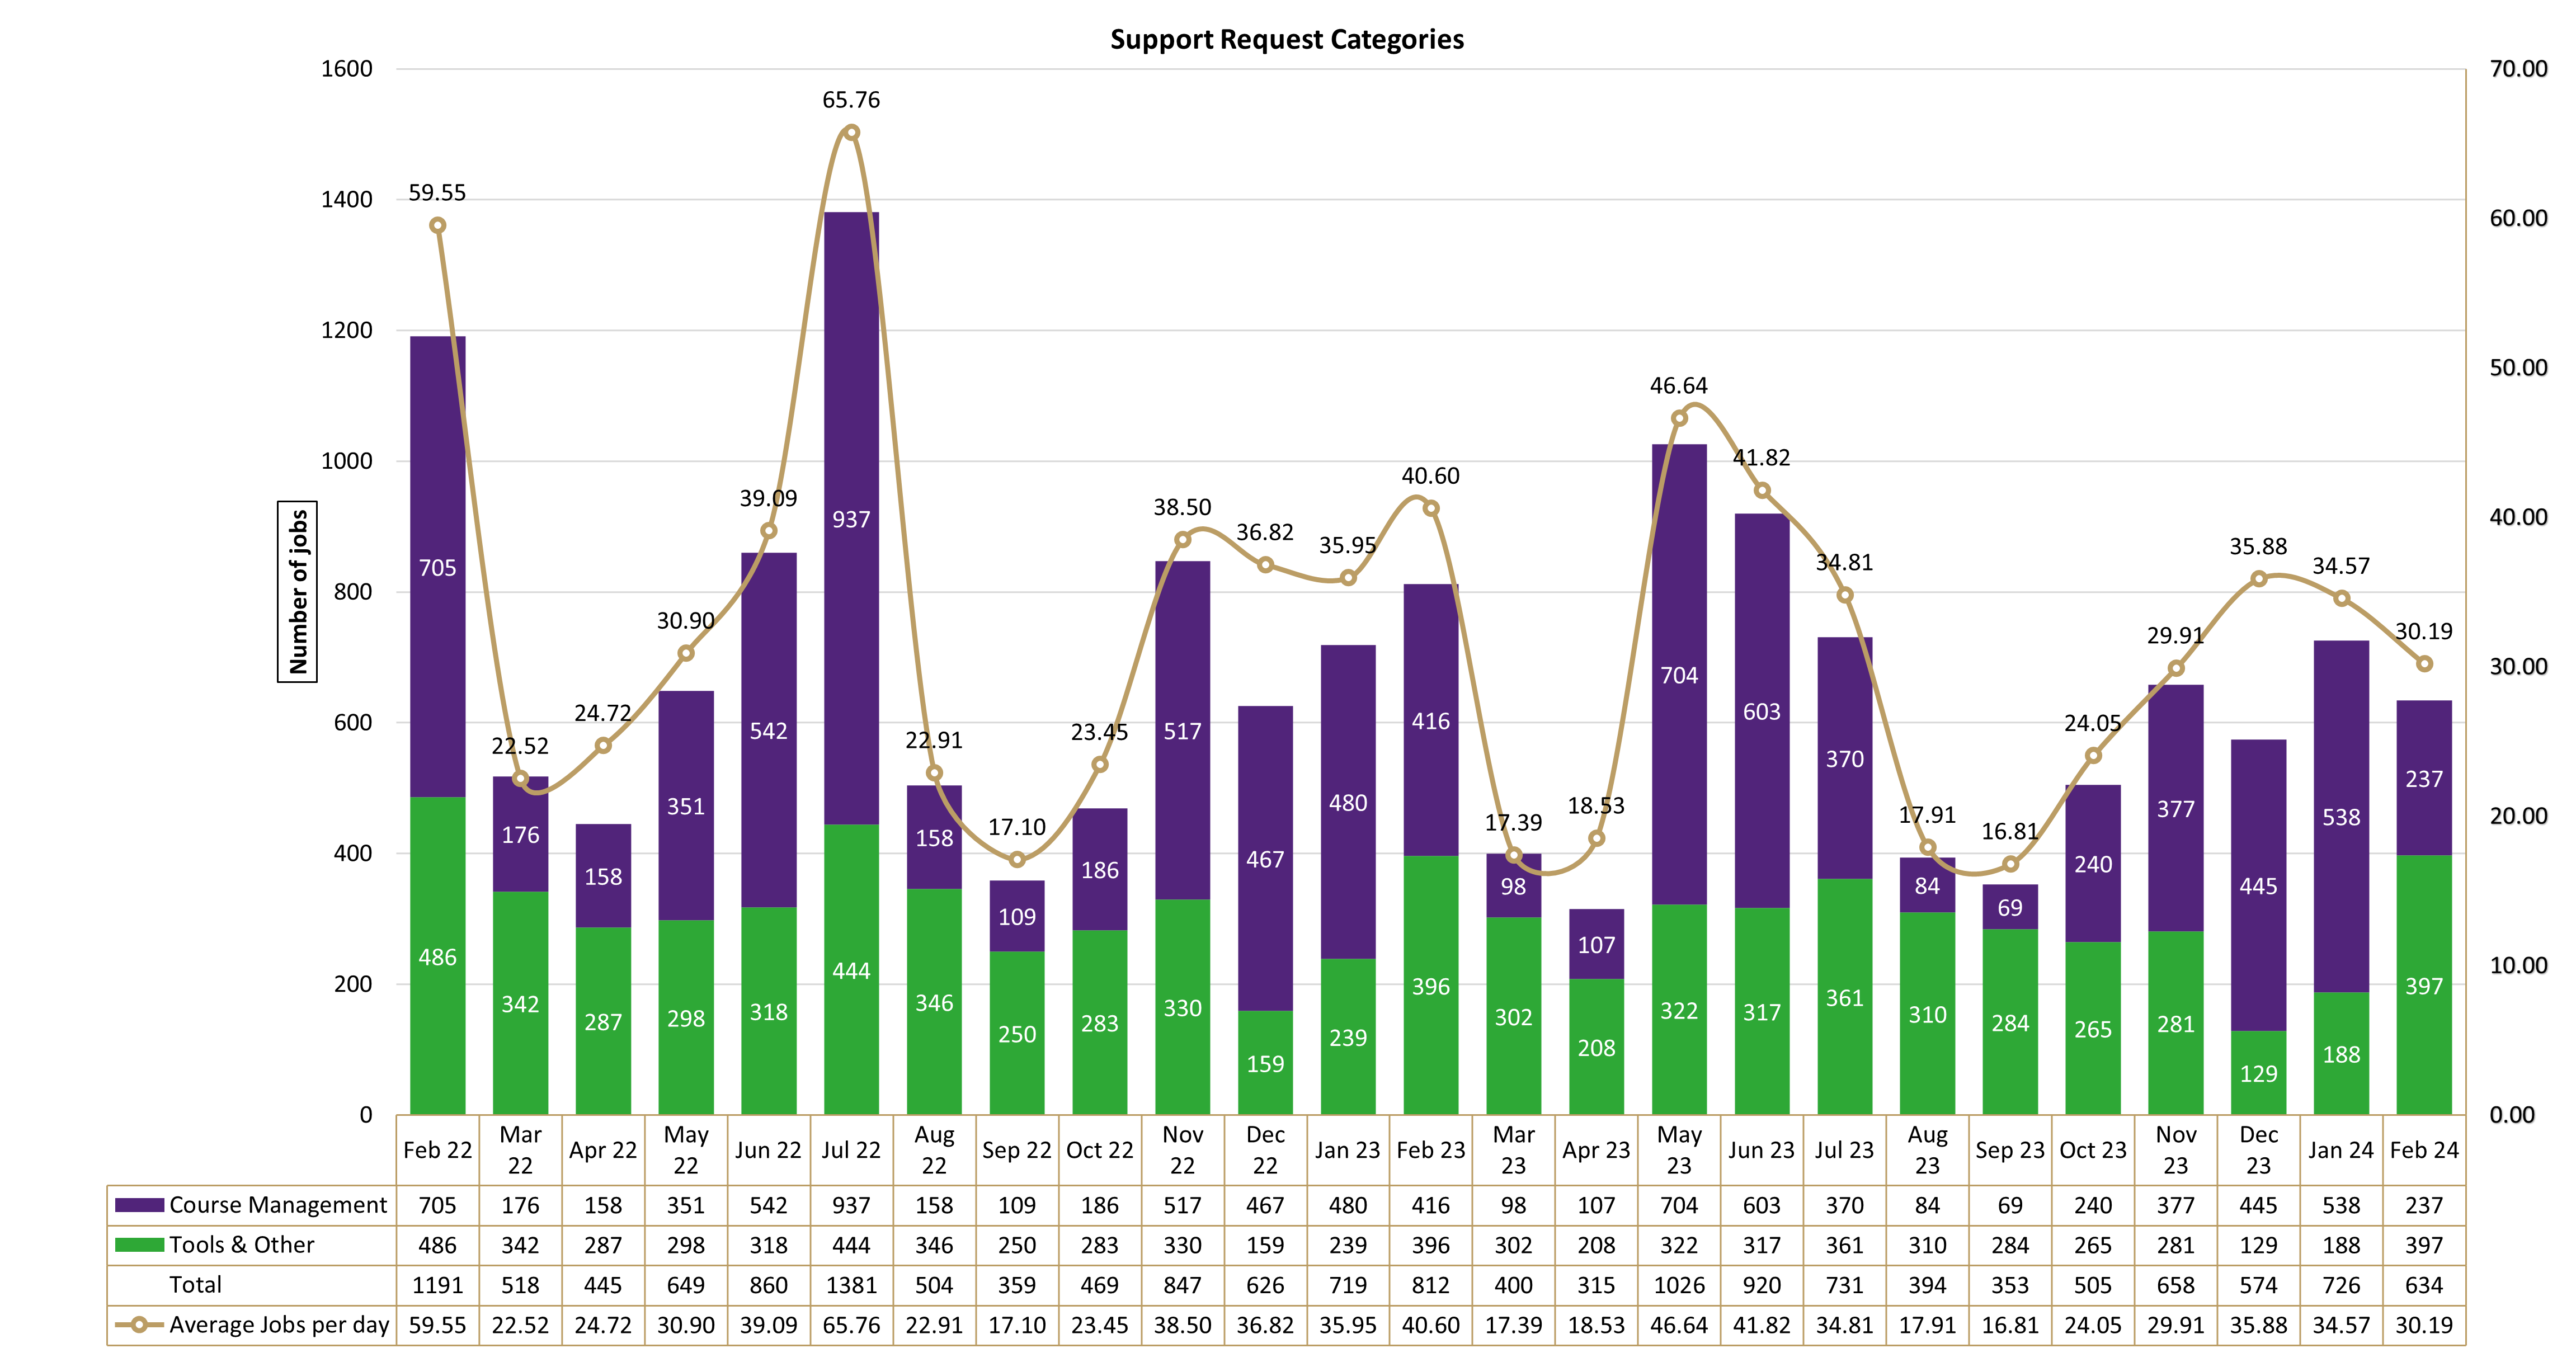
The number of jobs for February 2024 decreased by 21.9% when compared to February 2023 and decreased by 46.8% when compared to February 2022 and decreased by 12.7% when compared to January 2024.
Course Management jobs for February 2024 decreased by 43% when compared with February 2023 and decreased by 66.4% when compared with February 2022 and decreased by 55.9% when compared with January 2024.
Tools & Other jobs for February 2024 increased by 0.3% when compared with February 2023 yet decreased by 18.3% when compared with February 2022 yet increased by 52.6% when compared with January 2024.
The distribution of jobs were mainly in favour of Tools & Other (62.62%) with Course Management (37.38%).
The Distribution of Jobs per Faculty