April 2023 Usage Statistics
eLearning workshops
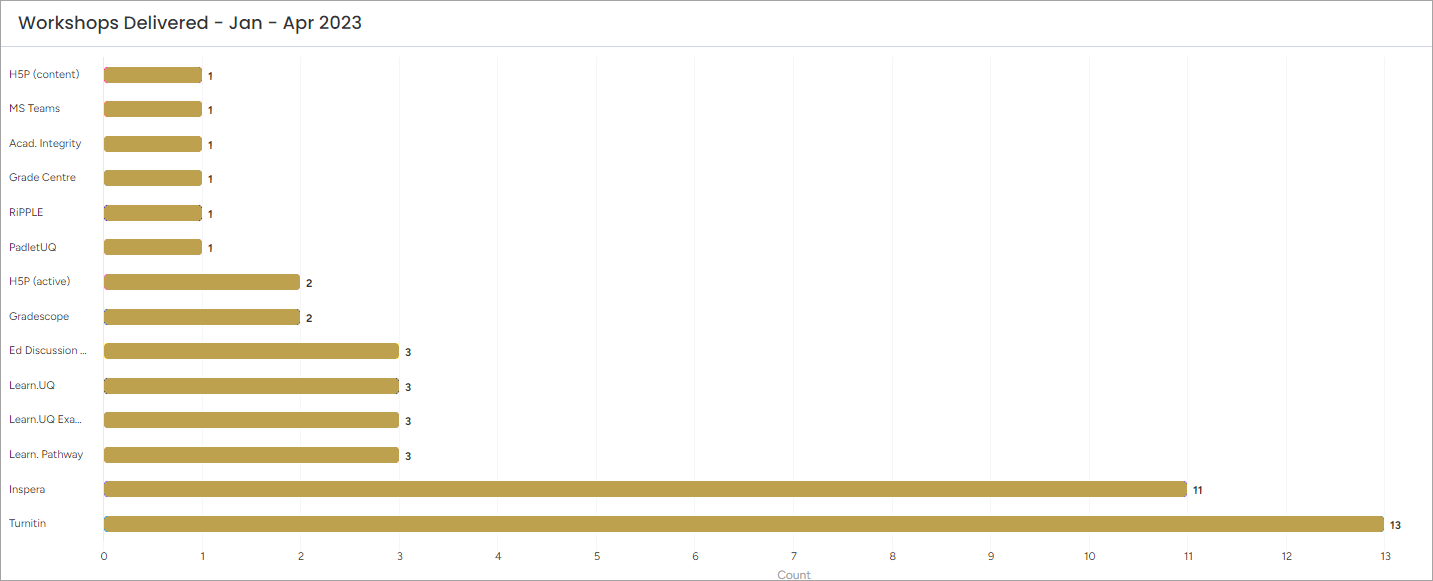
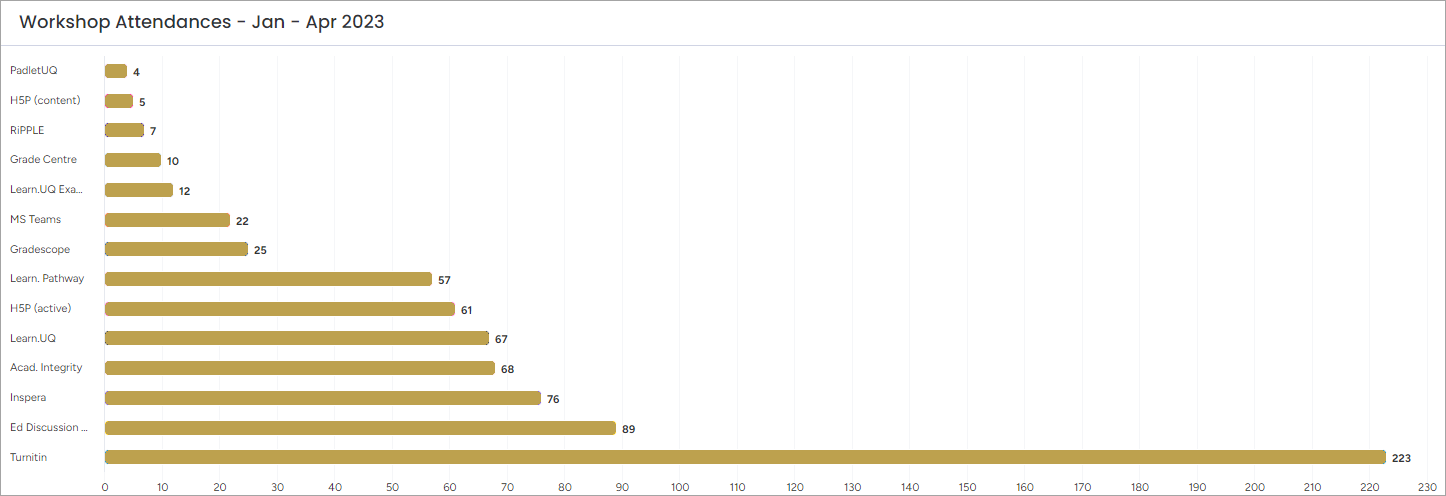
Workshops run and staff attendance
Practical, hands-on workshops in teaching and learning technologies are offered through Workday to help staff prepare their courses each semester. In April, 10 workshops were conducted with 152 participants attending. This year to date, 48 staff workshops have been run with a total of 838 attendances. Since 2012, there has been a total of 10,516 staff workshop attendances.
Self-paced workshop completions
| Workshop | Number of engagements | Number of completions |
|---|---|---|
| Learn.UQ Basics | 10 | 3 |
| Learn.UQ Quizzes, Tests and Exams | 2 | 2 |
| Virtual Classroom (Zoom) | 1 | 1 |
| Desktop Recording (Kaltura Capture) | ||
| Video Assignment | ||
| Turnitin | 3 | 2 |
| Grade Centre | 1 | 0 |
| LearnX / Edx (Edge) | 8 | 1 |
| Total | 25 | 9 |
eLearning guides
Guide updates
The following table displays the number of staff and student guides that have been created, updated and removed this year to date.
| Guides Created | Guides Updated | Guides Removed |
|---|---|---|
| 19 | 114 | 47 |
Total = 180 | ||
Top 10 eLearning guides
The following list includes the 10 most viewed eLearning guides this month:
Create a Grade Schema (1-7 grades) (1569 views)
Academic Integrity Modules (1217 views)
- Learn.UQ Welcome Page (1203 views)
What is an ePortfolio? (514 views)
Turnitin Generative AIwriting detection indicator preview (482 views)
Turnitin (383 views)
Academic Integrity and Assessment Security in Inspera (361 views)
Access Inspera (360 views)
Inspera Exam Portal Installers (324 views)
Turnitin Generative AI writing Indicator (274 views)
Total webpage views: 29,274
Total webpage views for previous month (March 2023): 39,062
April YouTube views: 2,684
YouTube views for preview month (March): 2,945
eLearning Adviser Consultations
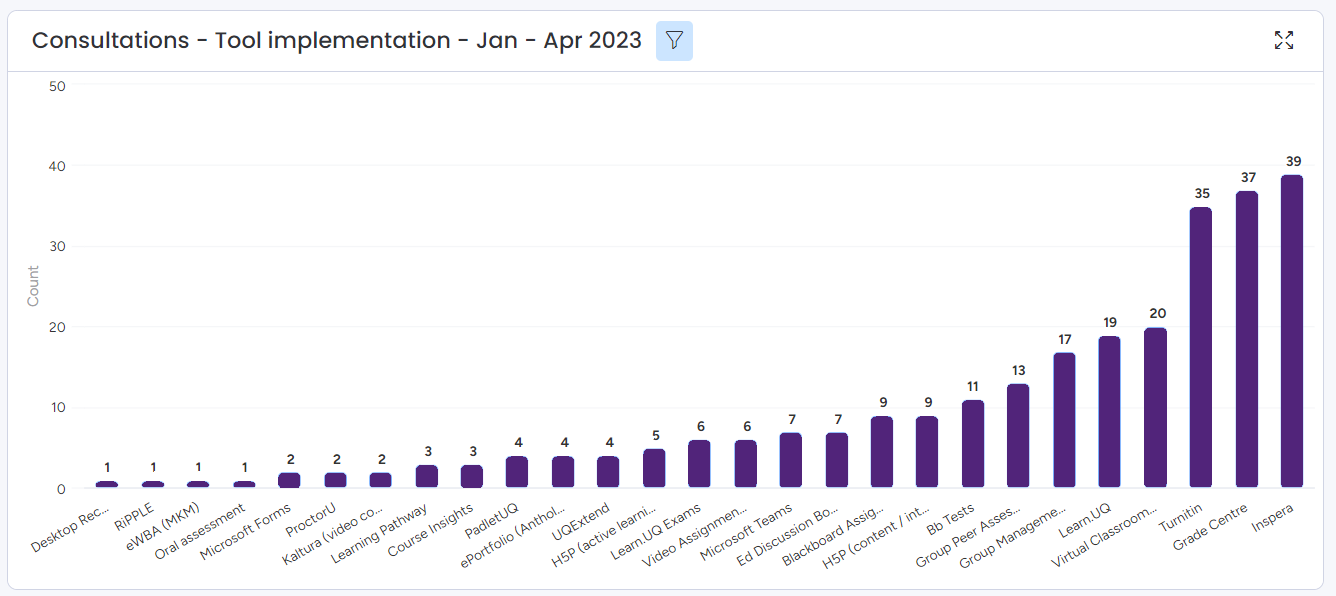
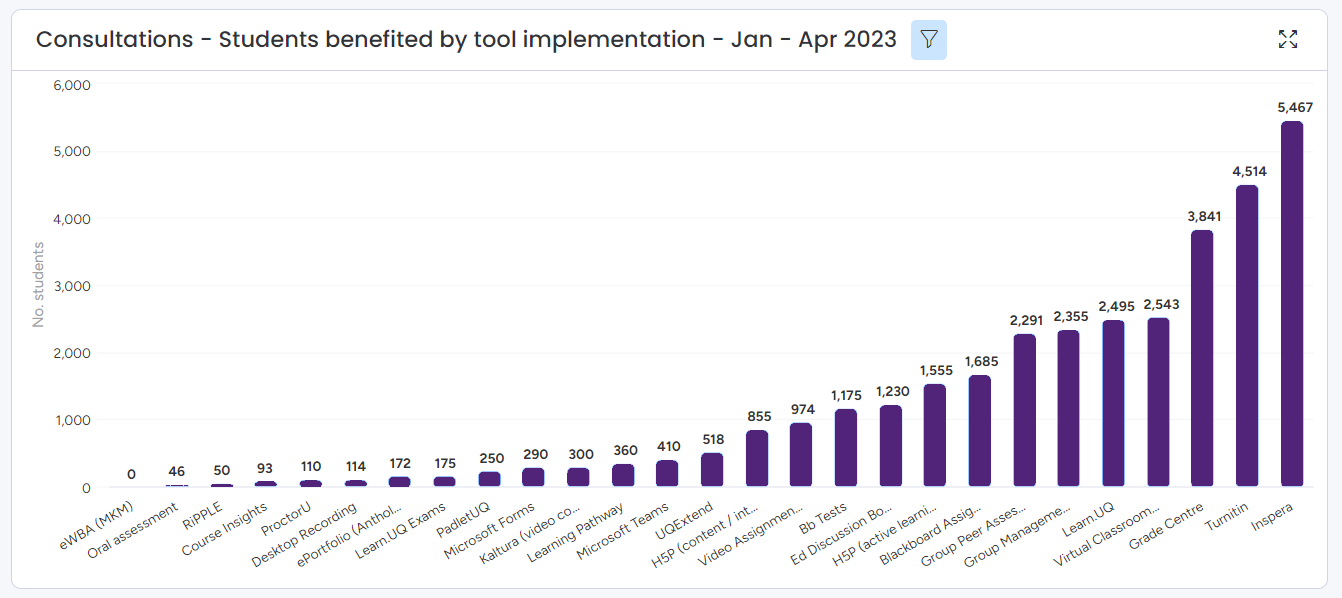
In the month of April, eLearning advisers provided 36 appointments to help \course coordinators adopt eLearning technology. The eLearning Adviser Consultations to date in 2023 have catered for 124 Course Coordinators teaching into 150 courses which constitute approximately 4.2% of all courses in the university and servicing a total of 18,943 student experiences across the university. In total, the number of appointments equals 179. The top three most common individual tools implemented are Online quiz/exam (Inspera), Grade Centre, and Online marking/submission (Turnitin).
Individual tools - Time implemented
Individual tools - Student benefited
ePortfolio usage
Usage in April | Usage this year to date |
|---|---|
| Assessments: 1930 | 5463 |
| Files Uploaded: 3259 | 9688 |
eLearning Support - Requests and Trends
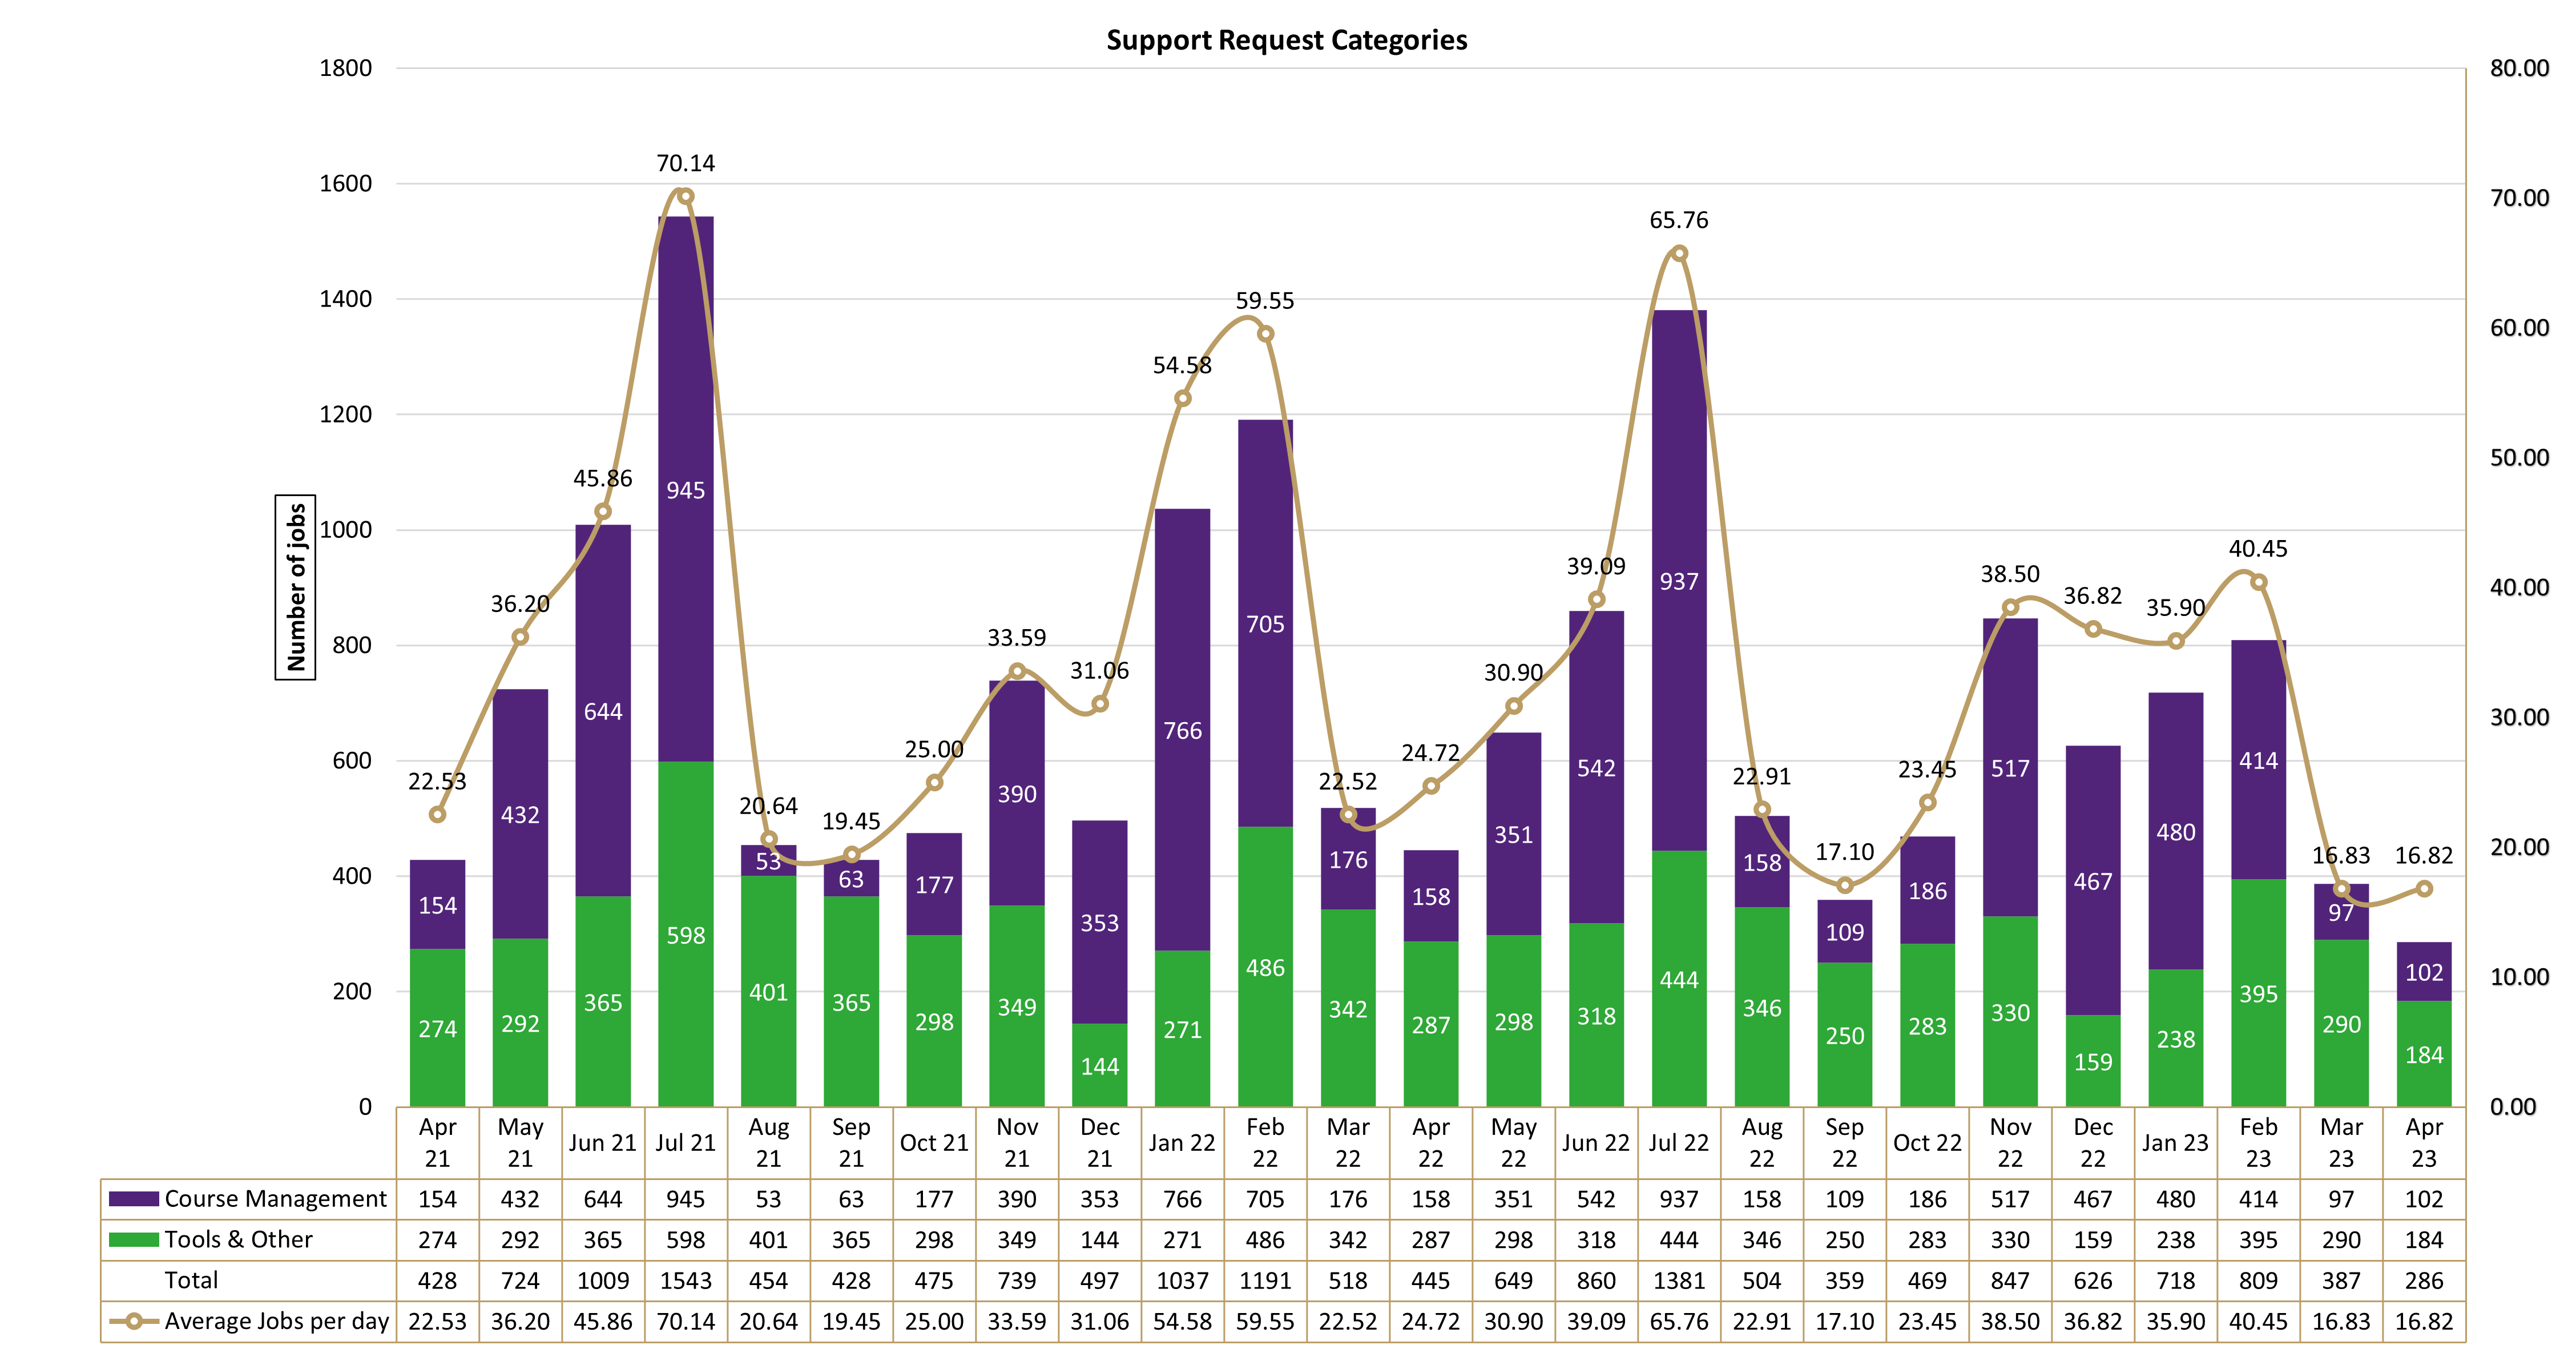
Download Support Request Categories-202304.csv
The number of jobs for April 2023 decreased by 35.7% when compared to April 2022 and decreased by 33.2% when compared to April 2021 and decreased by 26.1% when compared to March 2023.
Course Management jobs for April 2023 decreased by 35.4% when compared with April 2022 and decreased by 33.8% when compared with April 2021 yet increased by 4.9% when compared with March 2023.
Tools & Other jobs for April 2023 decreased by 35.9% when compared with April 2022 and decreased by 32.8% when compared with April 2021 and decreased by 36.6% when compared with March 2023.
The distribution of jobs were mainly in favour of Tools & Other (64.34%) with Course Management (35.66%).
RESPONSE TO SUPPORT REQUESTS FLAGGED AS URGENT BY CLIENTS
During April 2023 there were fourteen (14) Urgent jobs. A breakdown of the Urgent jobs are as follows.
Blackboard Assignment Tool (1), Blackboard Groups (2), Blackboard Population (1), Open EdX edge (1), Inspera (3), Training (2), Turnitin (4).
All Urgent requests were responded to within an hour.
*Starting from April 2023 the data collection and filter process for obtaining eLearning support statistics has been updated. Current data listed above may differ slightly with a previous months data values. The above chart has been backdated to incorporate the slight differnces in differentiation between "Course Tools & Other" Jobs when related to "Course Management" Jobs. Additionally when reviewing previous data it is possible for the monthly total jobs to change. An increase usually relates to jobs being resolved after the specific monthly deadline where a decrease usually relates to Jobs being reopened and resolved during a later month.