July 2024 Usage Statistics
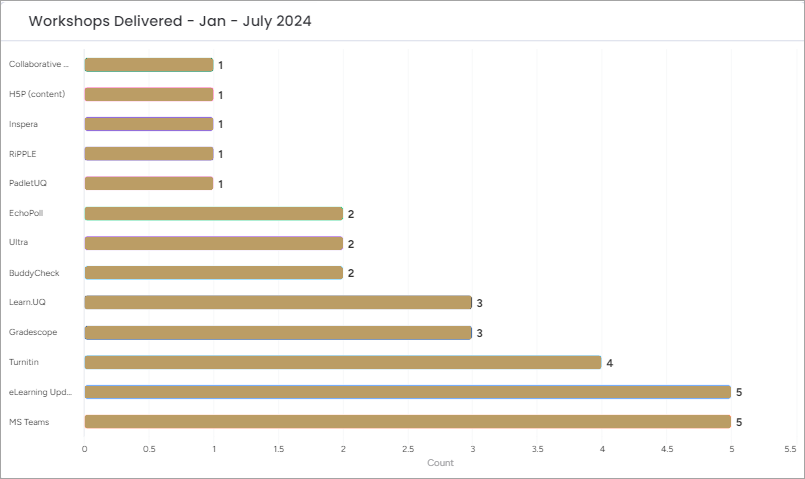
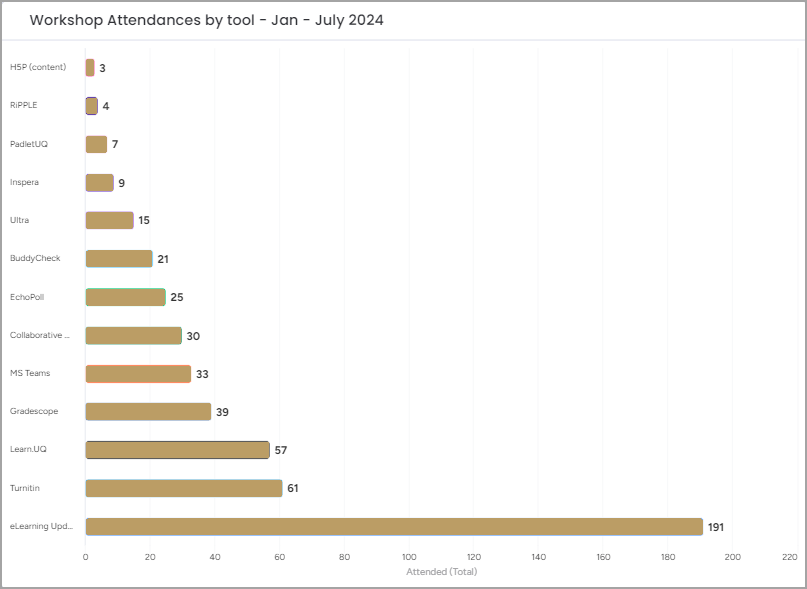
Practical, hands-on workshops in teaching and learning technologies are offered to help staff prepare their courses each semester. In July, 12 workshops were conducted with 163 participants attending. This year to date, 46 staff workshops have been run with a total of 715 attendances. Since 2012, there has been a total of 12,113 staff workshop attendances.
eLearning guides
Displays the number of staff and student guides that have been created, updated and removed this year to date.
| Guides Created | Guides Updated | Guides Removed |
|---|---|---|
| 124 | 108 | 23 |
Total = 255 | ||
Top 10 eLearning guides
The following list includes the 10 most viewed eLearning guides this month:
- Create a Grade Schema (1-7 grades) (764 views)
- Learn.UQ Welcome Page (597 views)
- Discussion board Delete Threads and Edit/Delete Replies (525 views)
- What is an ePortfolio? (428 views)
- Course Profile (423 views)
- Publishing a Zoom recording to Echo360 (370 views)
- In-class Active Learning tools (331 views)
- Reactions in a Zoom meeting (326 views)
- Access Student Headshots (317 views)
- Weighted column (Final Marks) (242 views)
Total webpage views: 33,501
Total webpage views for the previous month (June 2024): 30,866
July YouTube views: 1,761
YouTube views for previous month (June 2024): 1,699
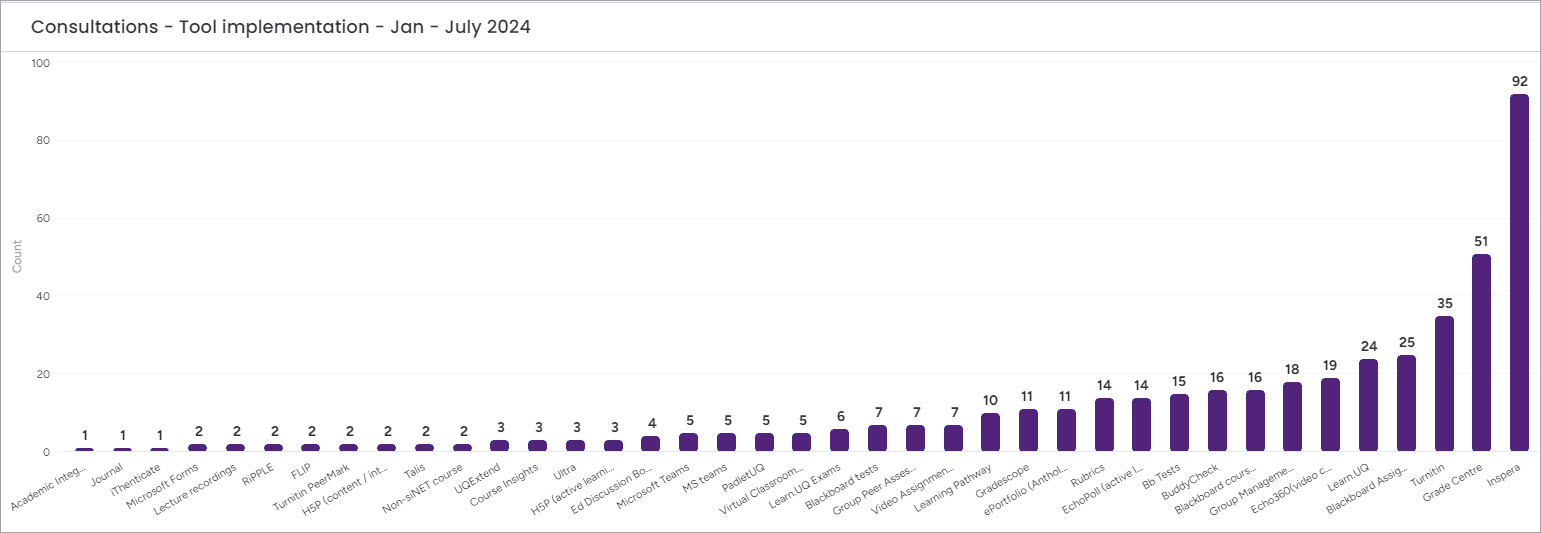
eLearning Adviser Consultations
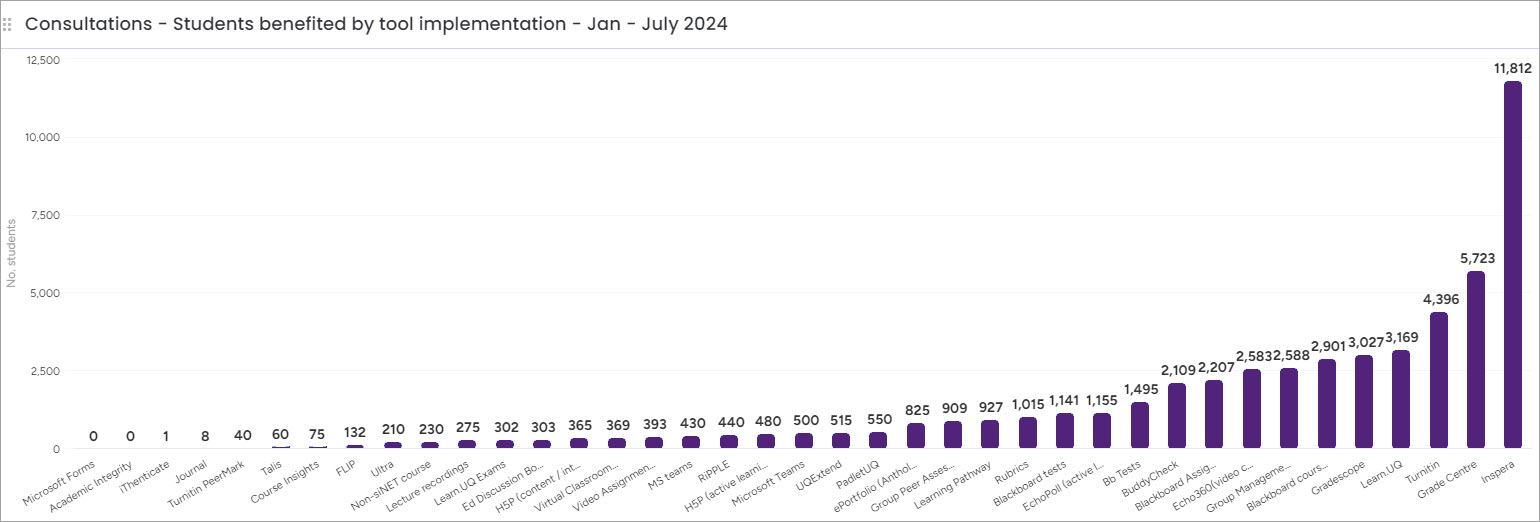
In July, eLearning advisers provided 59 appointments to help courses adopt eLearning technology. The eLearning Adviser Consultations to date in 2024 have catered for 238 Course Coordinators teaching into 300 courses which constitute approximately 8.4% of all courses in the university and servicing a total of 34,524 student experiences across the university. In total, the number of appointments equals 361. The top three most common individual tools implemented are Inspera, Grade Centre, and Turnitin.
Individual tools - Time implemented
Individual tools - Student benefited
ePortfolio usage
Usage in July | Usage this year to date |
|---|---|
| Assessments: 535 | 10216 |
| Files Uploaded: 882 | 24164 |
eLearning Support - Requests and Trends
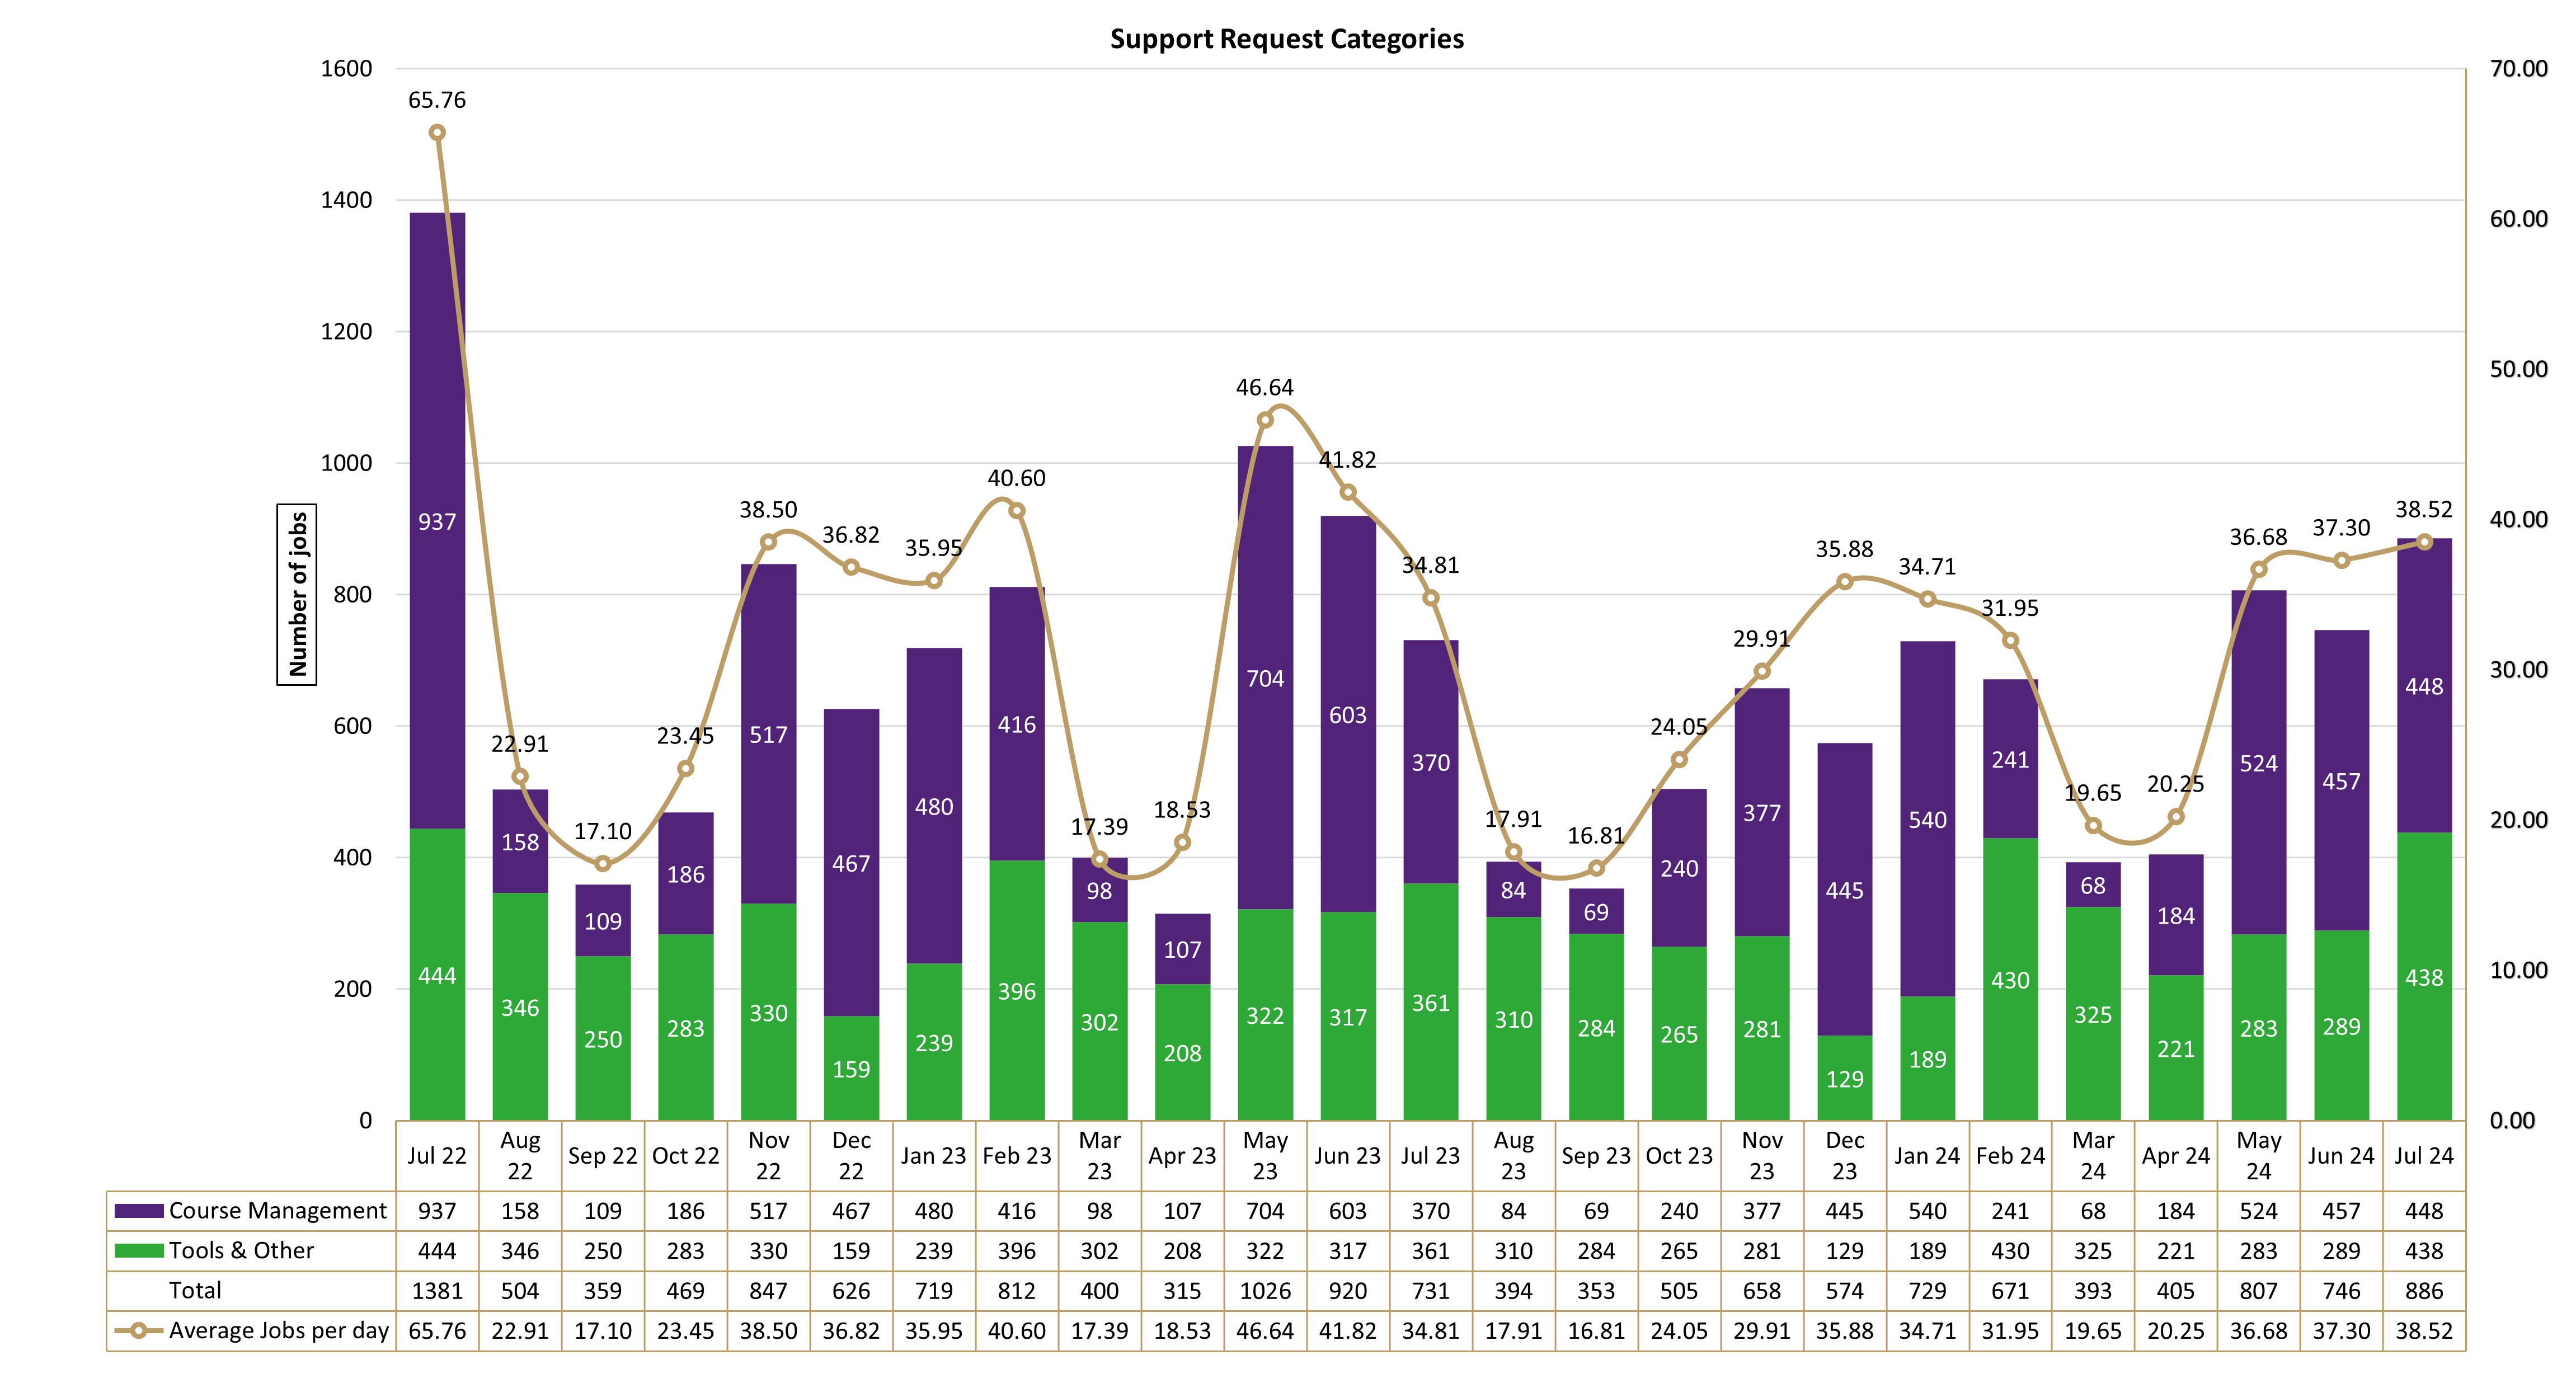
Download Support Request Categories-202407.csv
The number of jobs for July 2024 increased by 17.5% when compared to July 2023 yet decreased by 35.8% when compared to July 2022 yet increased by 15.8% when compared to June 2024.
Course Management jobs for July 2024 increased by 17.4% when compared with July 2023 yet decreased by 52.2% when compared with July 2022 and decreased by 2% when compared with June 2024.
Tools & Other jobs for July 2024 increased by 17.6% when compared with July 2023 yet decreased by 1.4% when compared with July 2022 yet increased by 34% when compared with June 2024.
The distribution of jobs were similarly divided amongst Course Management (50.56%) with Tools & Other (49.44%).
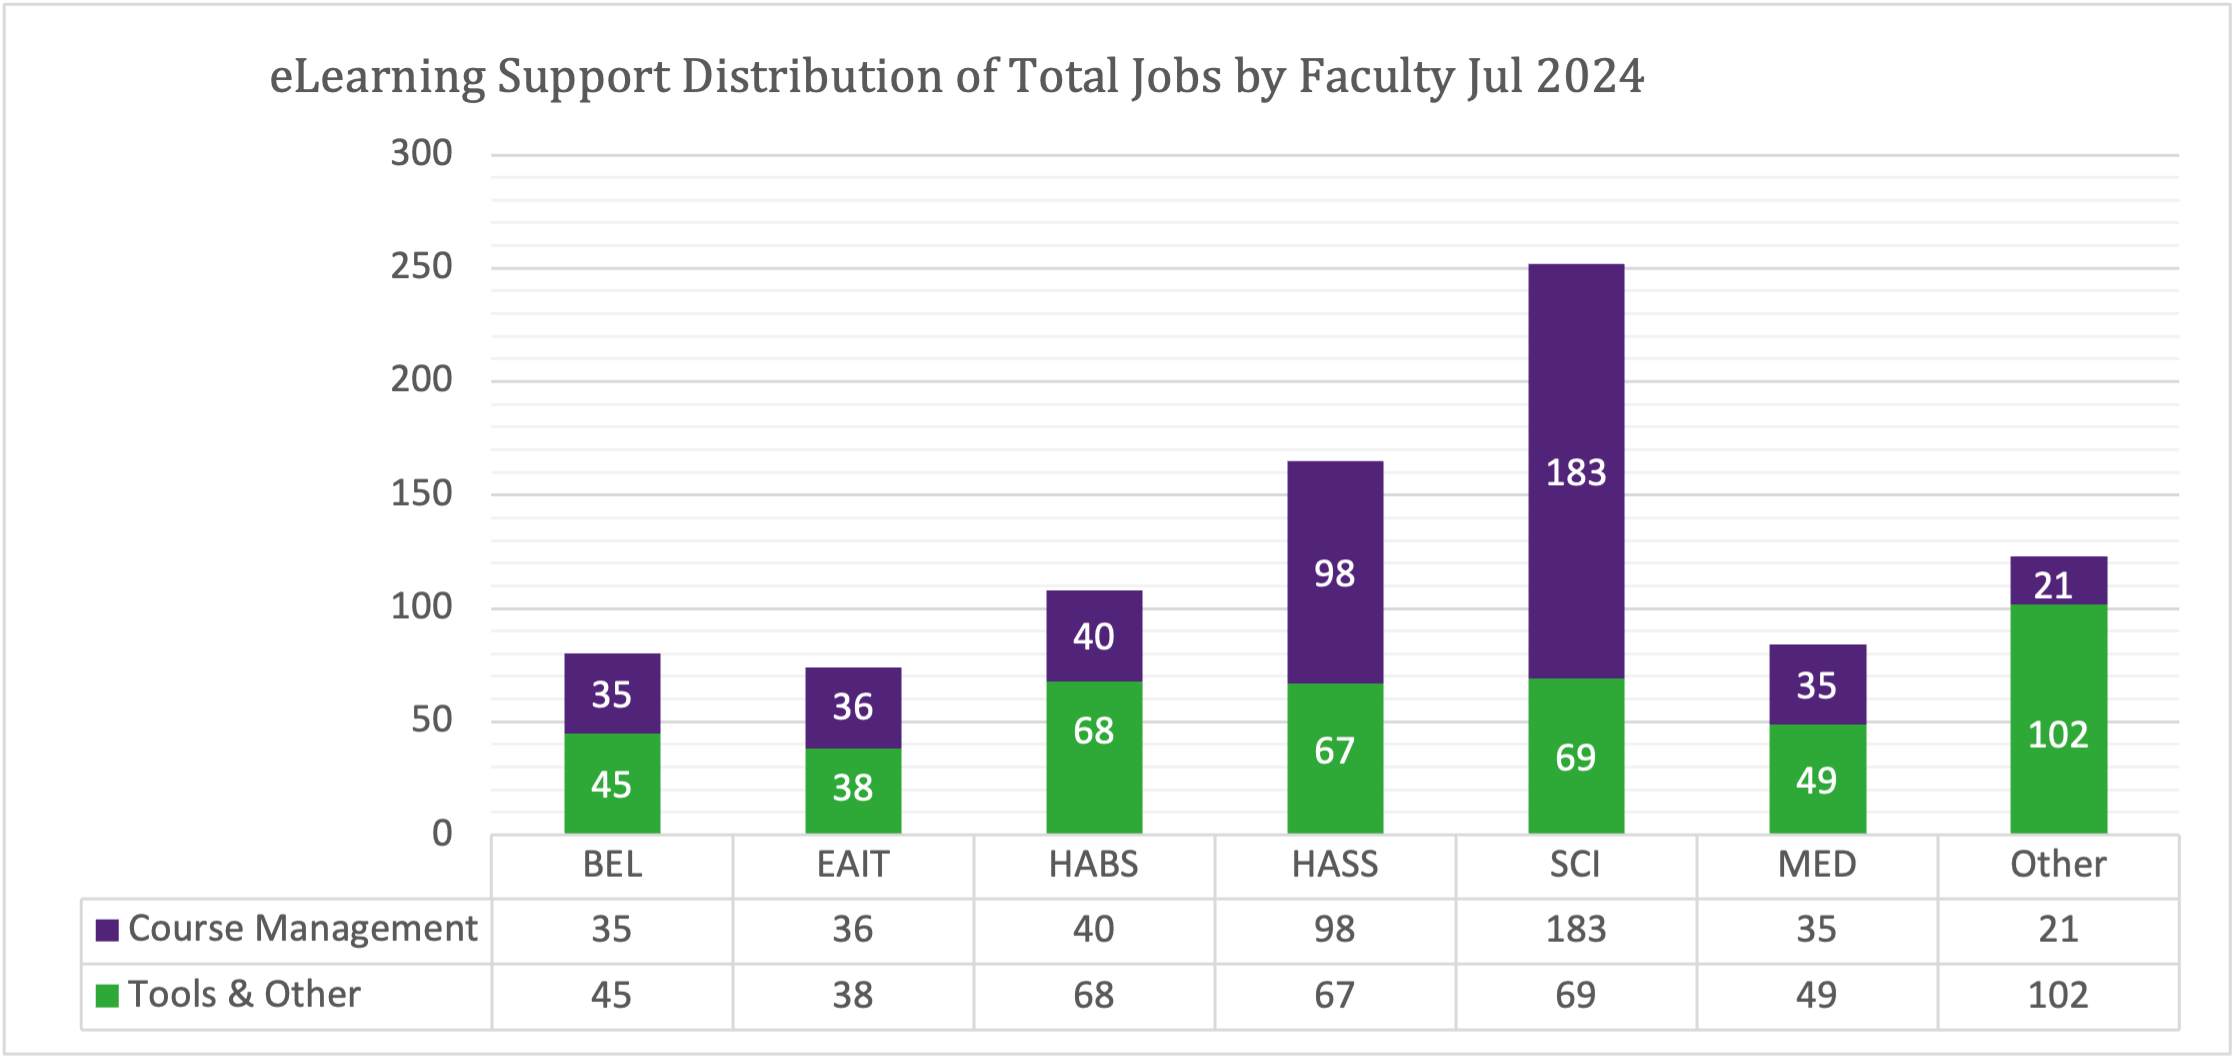
The Distribution of Jobs per Faculty
RESPONSE TO SUPPORT REQUESTS FLAGGED AS URGENT BY CLIENTS
During July 2024 there were twenty three (23) Urgent jobs. A breakdown of the Urgent jobs are as follows.
Blackboard Access (8), Blackboard Course Content (1), Blackboard Population (1), Blackboard Usage (1), Echo360 (3), Inspera (2), MKM (1), Site Request (3), UQ Extend (3).
All Urgent requests were responded to within an hour.