July 2021 Usage Statistics
eLearning workshops
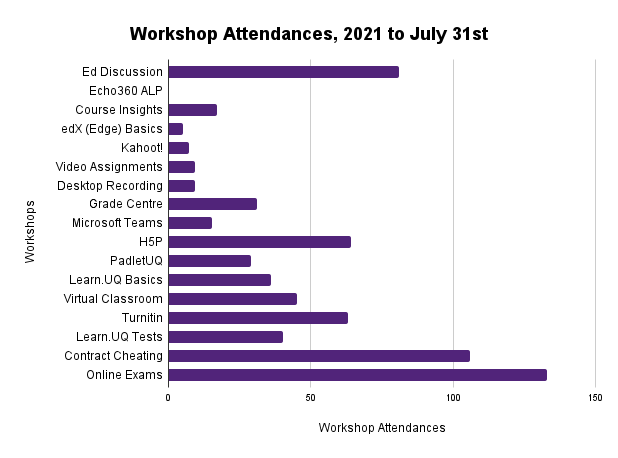
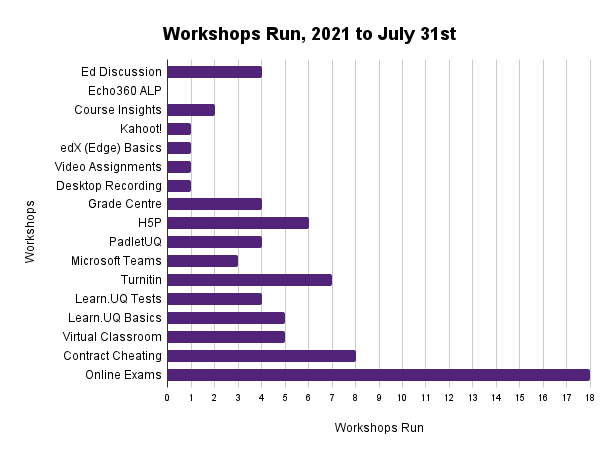
Workshops run and staff attendances
Practical, hands-on workshops in teaching and learning technologies are offered through Staff Development to help staff prepare their courses each semester. This month record 12 staff workshops has been run with a total of 146 attendances. This year to date, 74 staff workshops have been run with a total of 690 attendances. Since 2012, there has been a total of 7,840 staff workshop attendances.
Online workshop completions
| Workshop | Number of engagements | Number of completions |
|---|---|---|
| Learn.UQ Basics | 24 | 13 |
| Learn.UQ Quizzes, Tests and Exams | 28 | 12 |
| Virtual Classroom (Zoom) | 2 | 1 |
| Desktop Recording (Kaltura Capture) | 8 | 5 |
| Video Assignment | 6 | 3 |
| Turnitin | 12 | 5 |
| edX (Edge) | 34 | 15 |
| Total | 114 | 54 |
eLearning guides
Guide updates
The following table displays the number of staff and student guides that have been created, updated and removed this year to date.
| Guides Created | Guides Updated | Guides Removed |
|---|---|---|
| 18 |
321 |
8 |
|
Total guides updates = 347 |
||
Top 10 eLearning guides
The following list includes the 10 most viewed eLearning guides this month:
- ECP (1,101 views)
- Create a Grade Schema (1-7 grades) (1,029 views)
- Reactions in a Zoom meeting (1,012 views)
- Getting started with Padlet (782 views)
- Moving between Breakout Rooms (758 views)
- Add a Zoom recording (686 views)
- UQwordcloud (644 views)
- Link Ed Discussion Board (556 views)
- ePortfolio (403 views)
- Multiple Choice with mages (440 views)
Total webpage views = 43, 872
eLearning Solutions Service
The eLearning Solutions Service is designed to help staff implement the UQ eLearning tools that most successfully solve common teaching and learning problems. The eLearning Solutions Service to date in 2021 has catered for 230 Course Coordinators teaching into 303 courses which constitutes approximately 8.78% of all courses in the university and servicing a total of 40,543 student experiences across the university. The top three most common individual tools implemented are Online quiz / exam, Online marking / submission and Grade Centre .
| Individual tools | Times implemented | Students benefitted |
|---|---|---|
| Active learning tool | 14 | 2274 |
| Authorship | 4 | 862 |
| Collaboration / reflection tool | 10 | 1866 |
| eLearning refresher | 27 | 2137 |
| ePortfolio WIL - Chalk & Wire | 22 | 4418 |
| Grade Centre | 59 | 8577 |
| Group management | 27 | 7885 |
| Group Peer Assessment | 14 | 3230 |
| edX (Edge) | 13 | 1985 |
| H5P | 17 | 1935 |
| Microsoft Teams | 17 | 1561 |
| Online marking / submission | 70 | 11483 |
| Online mini lecture | 11 | 2577 |
| Online quiz / exam | 70 | 13185 |
| Self Peer Assessment Tool | 1 | 509 |
| Course Insights | 7 | 2512 |
| Video assignment | 16 | 2828 |
| Video content - Kaltura | 8 | 1374 |
| Virtual classroom - Zoom | 48 | 8885 |
| Other | 0 | 0 |
ePortfolio usage
|
Usage in June |
Usage this year to date |
|---|---|
| Assessments: 905 | 21186 |
| Files Uploaded: 1895 | 29286 |
eLearning Support - Requests and Trends
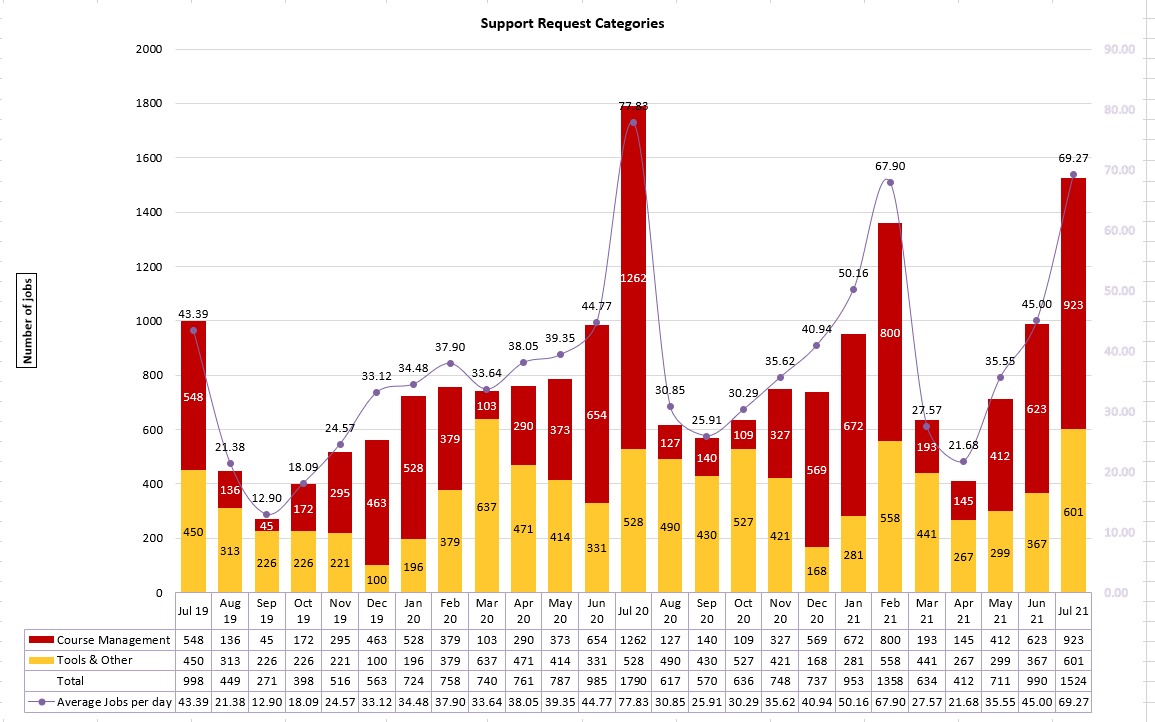
Download Support Request Categories-202107.csv
The number of jobs for July 2021 decreased by 14.9% when compared to July 2020 yet increased by 34.5% when compared to July 2019 and increased by 35% when compared to June 2021.
Course Management jobs for July 2021 decreased by 26.9% when compared with July 2020 yet increased by 40.6% when compared with July 2019 and increased by 32.5% when compared with June 2021.
Tools & Other jobs for July 2021 increased by 12.1% when compared with July 2020 and increased by 25.1% when compared with July 2019 and increased by 38.9% when compared with June 2021.
The distribution of jobs were mainly in favour of Course Management (60.56%) with Tools & Other (39.44%).
RESPONSE TO SUPPORT REQUESTS FLAGGED AS URGENT BY CLIENTS
There were seven Urgent jobs during July 2021. A breakdown of the Urgent jobs are as follows.
one of Blackboard Access, one of ECP, five of Exam related,
All Urgent requests were responded to within an hour.