Overall Average for Outcome by Student (Original)
Video Guide
Overall Average for Outcome by Student (YouTube, 2m 40s)
This report will allow you to see the overall average performance for a student against an outcome set.
- Log into the UQ ePortfolio.
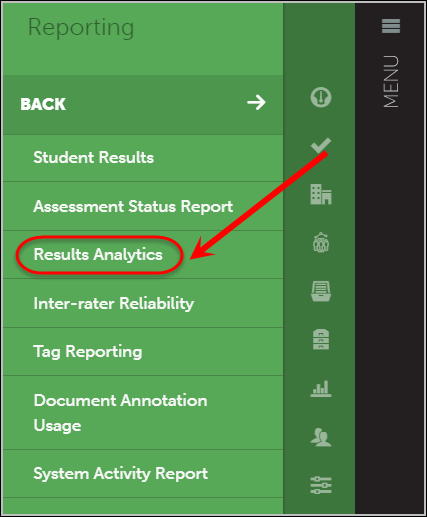
- Click on Menu > Reporting > Results Analytics.
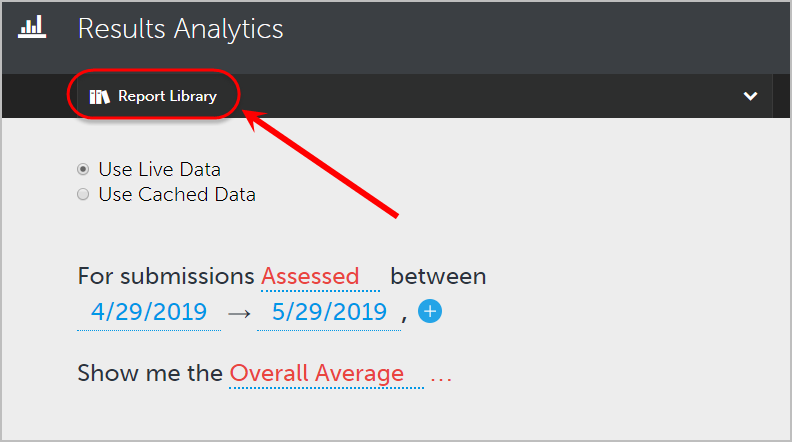
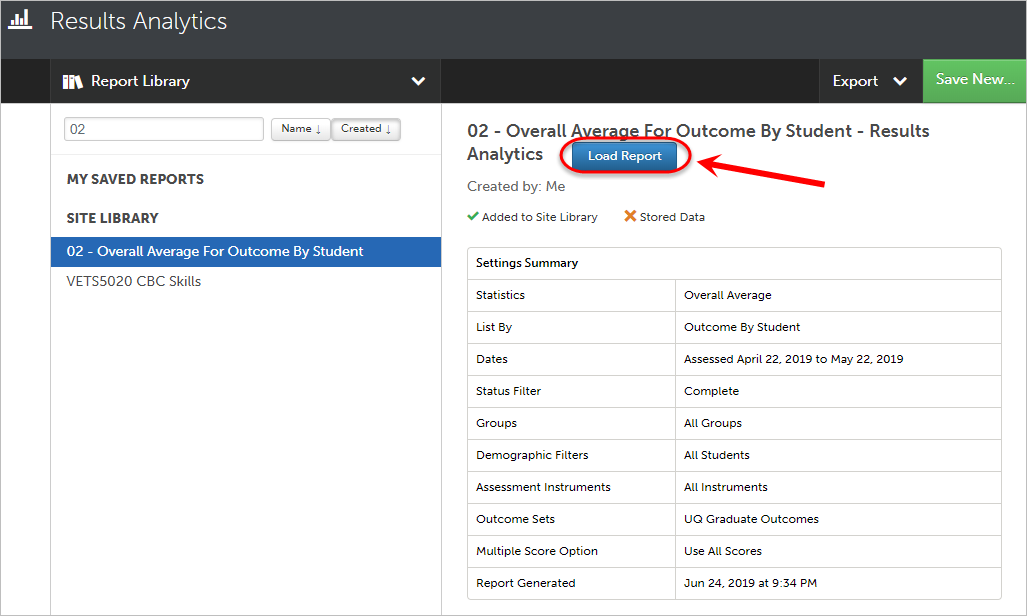
- Open the Report Library.
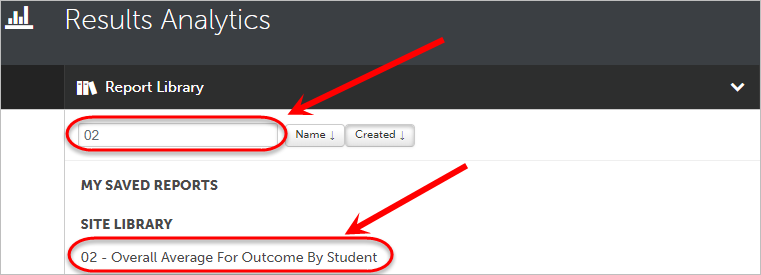
- Using the Search function, select 02 - Overall Average For Outcome By Student from the Report Library drop-down menu.
- Click on the Load Report button.
- Select the From date field and To date field and update to the required dates of your assessment.
- Click on the Apply button.
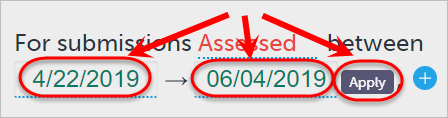
Note: The date format is in the US format of mm/dd/yyyy.
- Select the UQ Graduate Outcomes link to change to your desired outcome set.
![]()
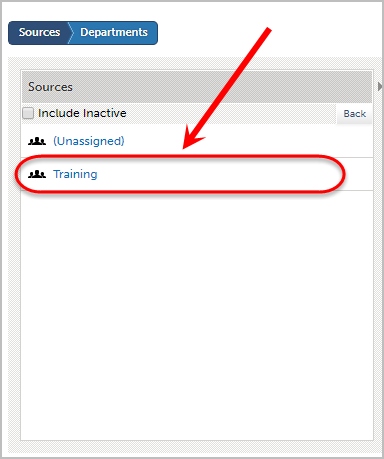
- Select your Department in the first column.
Note: Your School is known as a Department when using the ePortfolio.
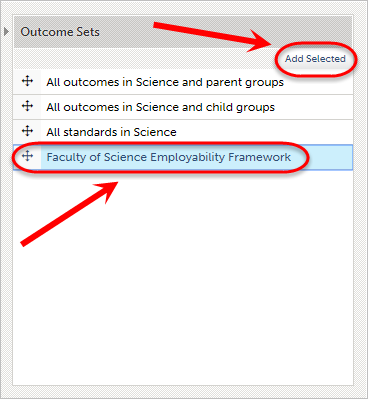
- Select your outcome set in the second column and click on the Add Selected button.
- In the third column, select the UQ Graduate Outcomes and click on the Delete Selected button.
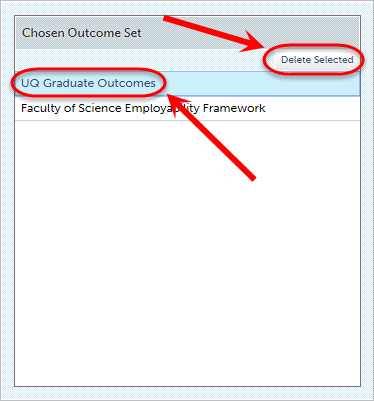
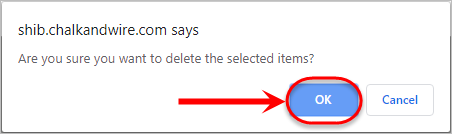
- Click on the OK button to accept the deletion.
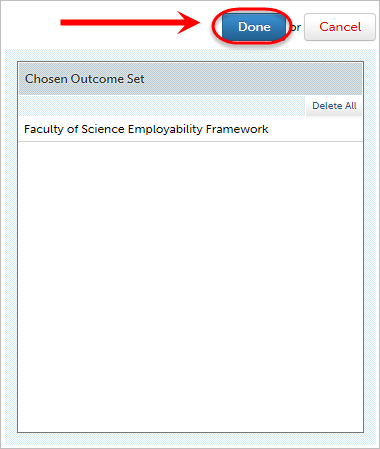
- Click on the Done button.
- Click on the Generate Report button.
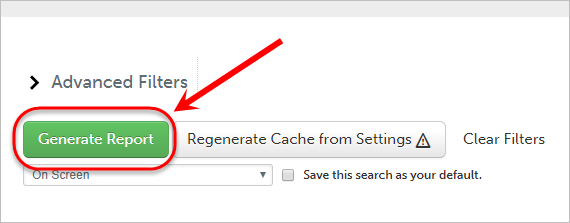
Note: Additional filtering options are available through Advanced Filters. For more information, refer to the Results Analytics with Advanced Filters guide.
Saving your report
Once your report has generated you can save a copy of the report to your own Saved Report Library by following the below steps:
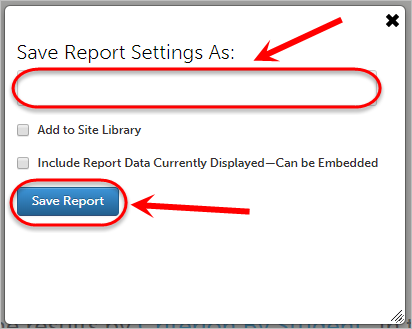
- Click on the green Save New... button.
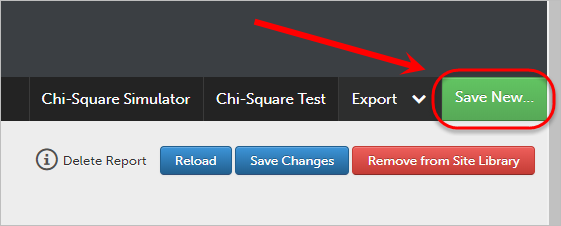
- Enter an informative report name in the Save Report Settings As: textbox.
- Click on the Save Report button.
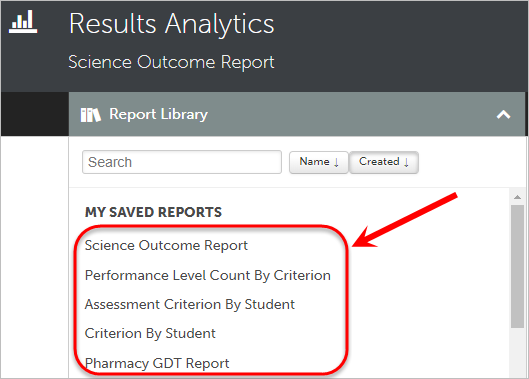
- Your report will be saved under My Saved Reports in the Report Library drop-down menu.
Exporting data to Excel
Once your report has generated you can export the data to excel by following the below steps:
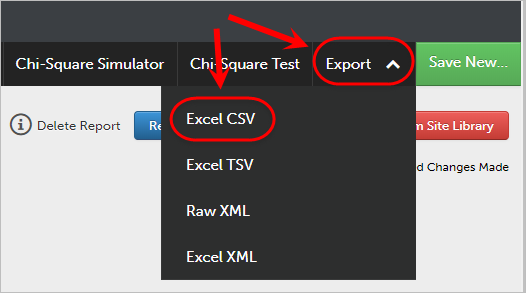
- Click on the Export drop-down list.
- Select Excel CSV from the Export drop-down list.