Test Summary (Original)
The Test Summary is made available when you run an Item Analysis of a test and provides data on the test as a whole (refer Run Item Analysis guide).
- Click on the link below Available Analysis
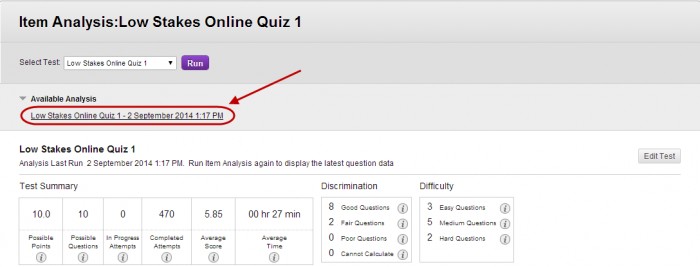
- Possible Points: The total number of points for the test.
- Possible Questions: The total number of questions in the test.
- In progress Attempts: The number of student currently taking the test that have not yet submitted it.
- Completed Attempts: The number of submitted tests.
- Average Score: The score displayed is the average score reported for the test in the Grade Centre. Scores with a * included tests that have not been marked and the average may change after all tests have been marked.
- Average Time: The average completion time for all submitted test attempts.
- Discrimination: Indicates how well a question differentiates between students. A question is considered a good discriminator when students who answer the question correctly also do well on the rest of the test.
- This area shows the number of questions that fall into the Good (greater than 0.3), Fair (between 0.1 and 0.3) and Poor (less than 0.1) categories. Cannot Calculate is displayed when the question’s difficulty is 100% or when all students receive the same score on a question.
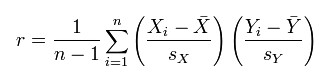
Calculation: Discrimination values are calculated with the Pearson correlation coefficient, X represents the scores of each student on a question and Y represents the scores of each student on the test.
- Difficulty: This area shows the number of questions that fall in the Easy (greater than 80%), Medium (between 30% and 80%) and Hard (less than 30%) categories.
Note: Only marked test attempts are used in the item analysis calculations. If there are attempts in progress, those attempts are ignored until they are submitted and you run the item analysis report again.