Question Statistics (Original)
The Question Statistics made available when you run an Item Analysis (refer Run Item Analysis guide). The question statistics table provides item analysis statistics for each question in the test.
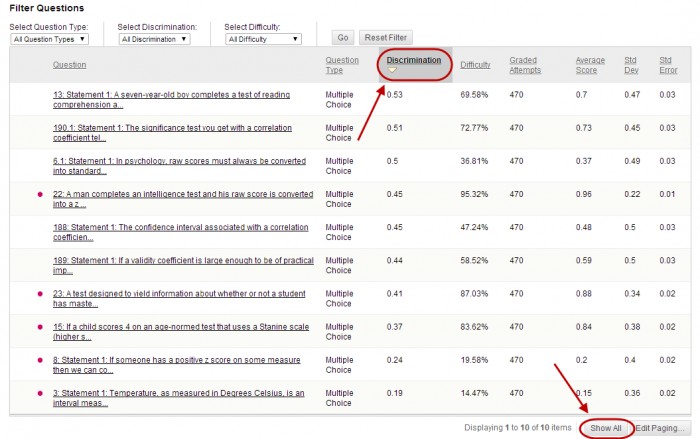
Question Statistics Table
- Click on the link below Available Analysis
- Click on the Show All button to show all the questions.
- Click on a column heading to sort by ascending order by category. Click again to sort descending order by category.
Columns
- Discrimination: Indicates how well a question differentiates between students. A question is considered a good discriminator when students who answer the question correctly also do well on the rest of the test. Values can range from -1.0 to +1.0 Questions are flagged for review with a red dot if their discrimination value is less than 0.1. Discrimination values cannot be calculated when the question’ difficulty score is 100% or when all student receive the same score on a question.
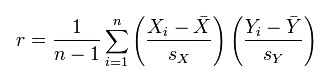
Calculation: Discrimination values are calculated with the Pearson correlation coefficient, X represents the scores of each student on a question and Y represents the scores of each student on the test.
- Difficulty: The percentage of students who answered each question correctly. Difficulty values can range from 1% to 100% with a high percentage indication that the question was easy. Questions are flagged for review with a red dot if there difficulty is Easy (greater than 80%) and Hard (less than 30%).
Note: High difficulty values do not assure high levels of discrimination.
- Grade Attempts: Number of questions attempts where marking is complete. i.e. Short answer, Essay and File response question types need to be marked by staff.
- Average Score: The score displayed is the average score reported for the test in the Grade Centre. Scores with a * included tests that have not been marked and the average may change after all tests have been marked.
- Standard Deviation: Measure of how far the scores deviate from the average score.
- If the scores are tightly grouped, with most of the values being close to the average, the standard deviation is small.
- If the data set is widely dispersed, with values far from the average the standard deviation is larger.
- Standard Error: An estimate of the amount of variability is a student’s score due to chance. The smaller the standard error of measurement, the more accurate the measurement provided by the test question.
Filter table
- Select the required option from the relevant drop down list to filter the table by Question Type, Discrimination and Difficulty.
- Click on the Go button.
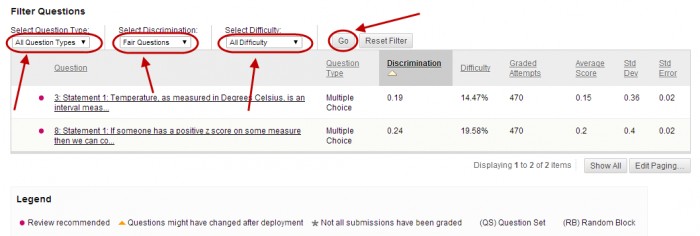
- Click on the Reset Filter button to display the original table again.
Based on: Blackboard Help: Item Analysis