EchoPoll - Individual question setups (Original)
While creating a question, it is important that you check out the question options to make sure the relevant settings are selected. Note: Some settings have been pre-selected in the:
If you select a setting in the Question Options, it will override the settings in the global and local setups for that question.
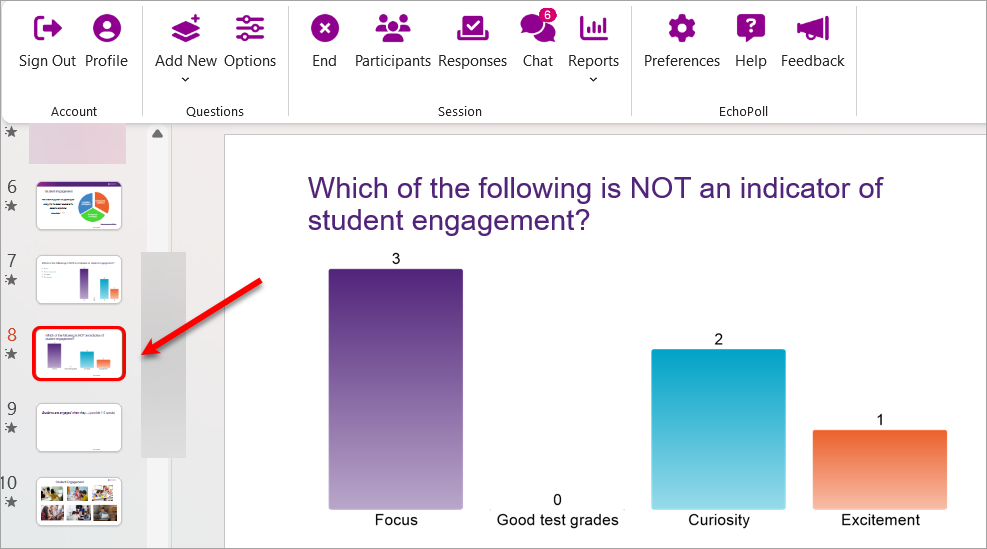
The Question Options panel is displayed alongside the question slide.
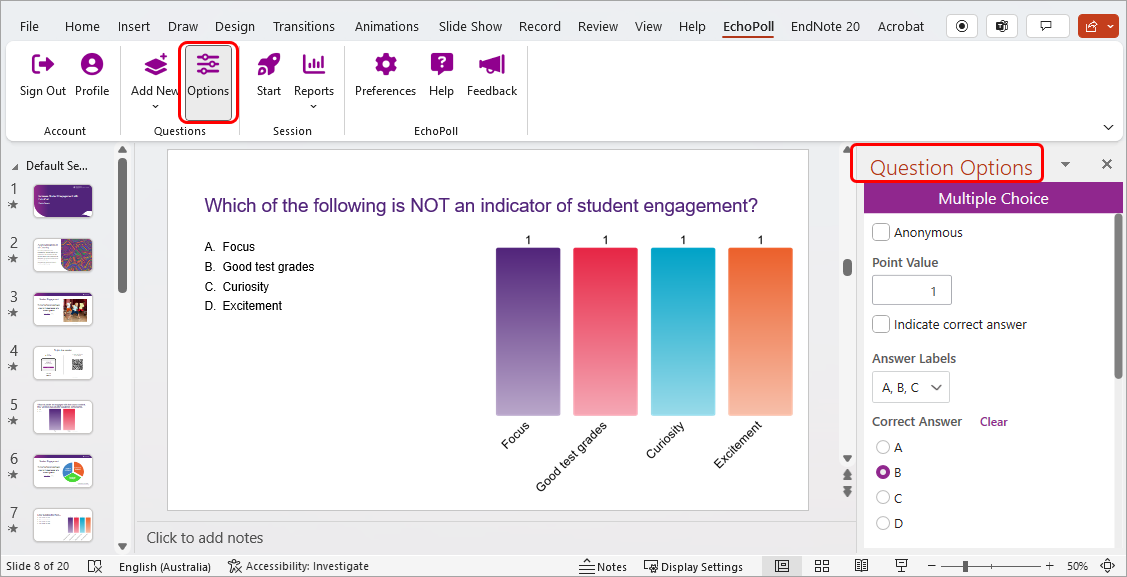
Question Options
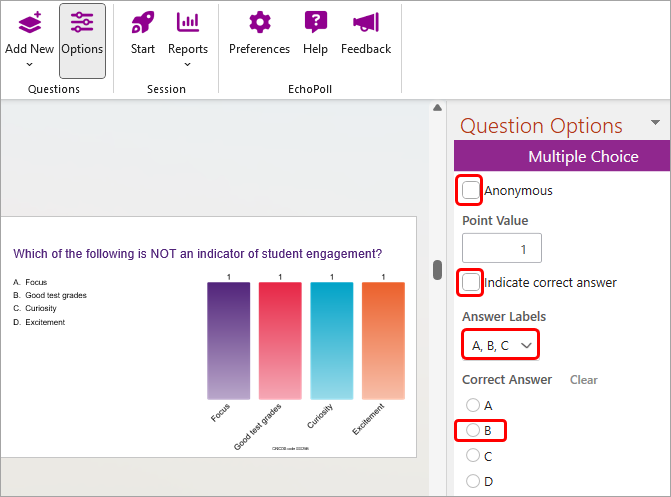
- Anonymous: participants' details will NOT be available for you.
- Point Value: a grade can be assigned for the question.
Note: If you selected Anonymous, then you can NOT assign a grade to a question. - Indicate the correct answer: the correct answer will be displayed after the polling question is completed; i.e. participants will know whether they selected the correct answer.
- Answer Labels: three styles are available:
- Capital letter: e.g. A
- Small letter: e.g. a, or
- Number: e.g. 1
- Chart: chart presentation can be displayed:
- vertically,
- horizontally,
- in doughnut chart,
- in pie chart , or
- responses only
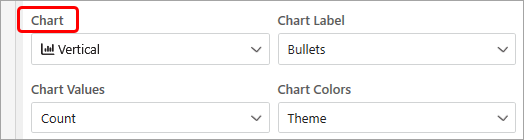
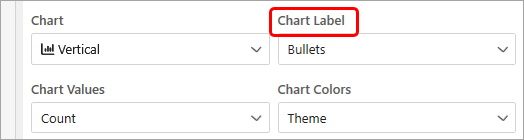
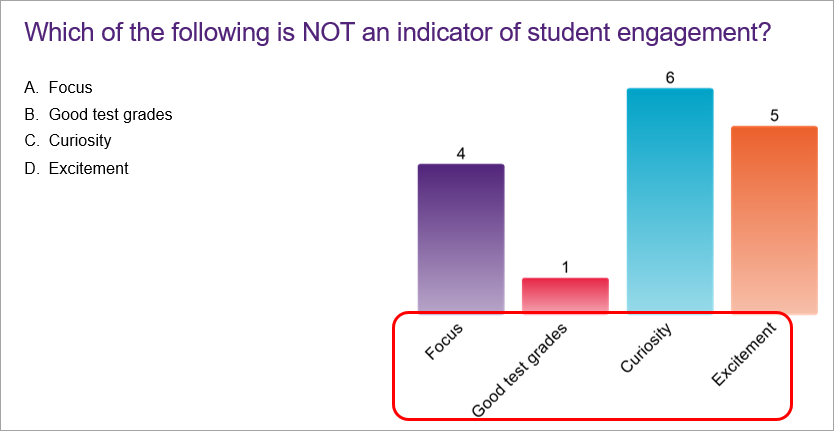
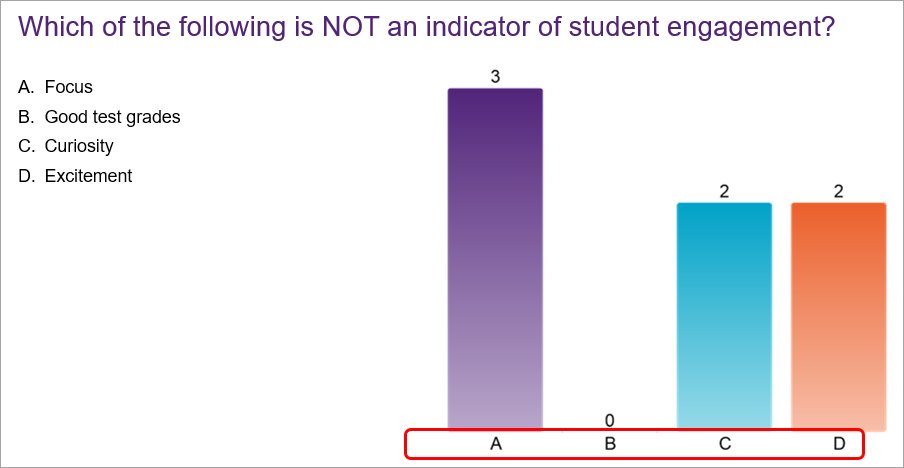
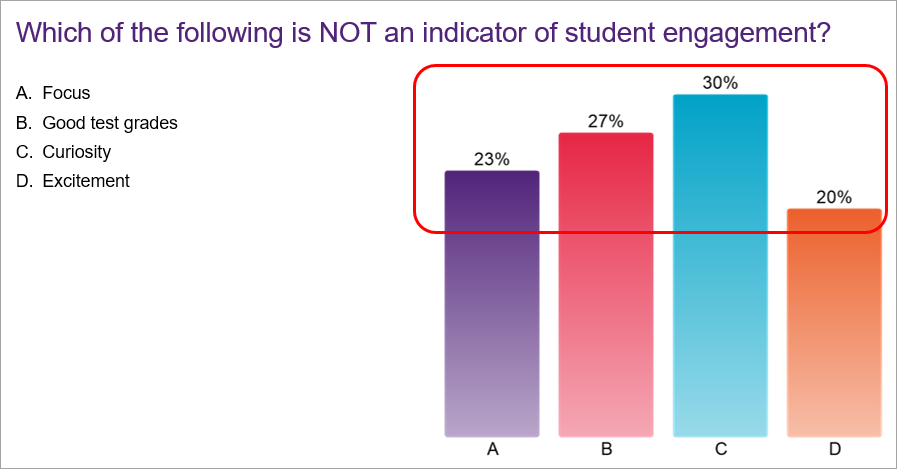
- Chart Label: labels on the chart can display the answers or the bullets
- Example of chart labels as answers
- Example of chart labels as bullets
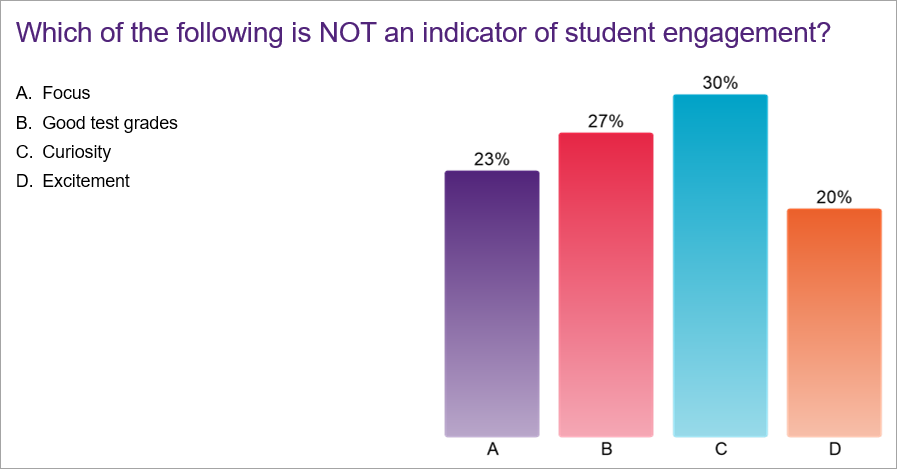
- Chart Values: polling results can be displayed in number (count), or percent.
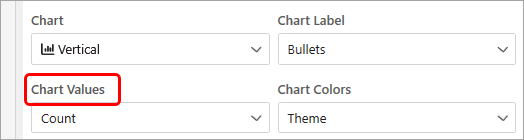
- Example of chart values as count:
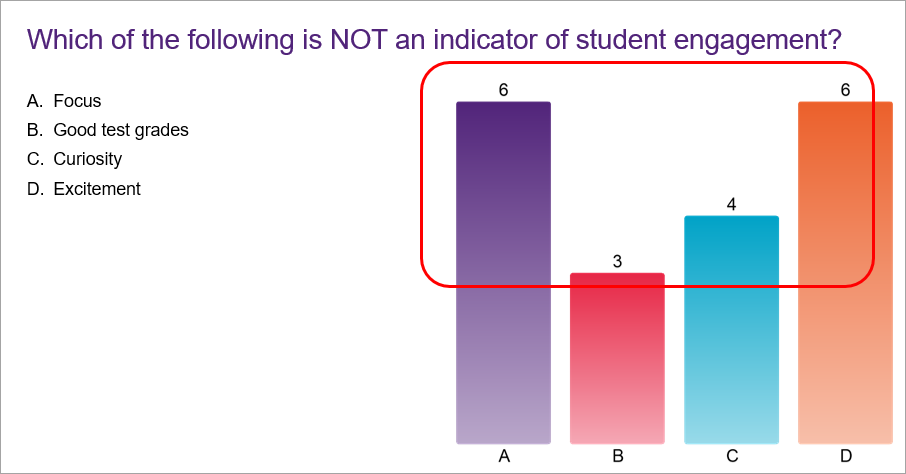
- Example of chart values as percent:
- Chart colors: theme, defined, graded
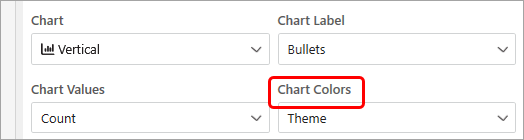
- Theme: the default option that auto apply the colors for the chart (as can be seen in previous captures)
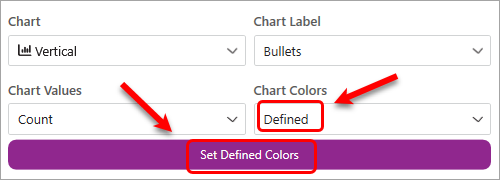
- Defined:
- Select the Defined option
- Click on the Set Defined Colors button.
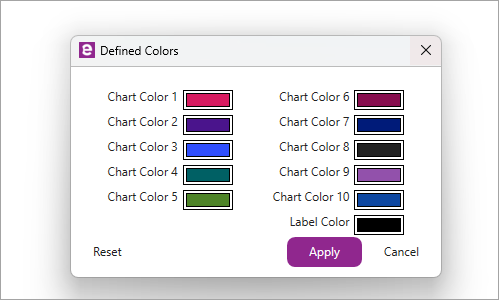
- Select the colors for your chart.
- Click on the Apply button.
- Graded: that chart will have different colors for correct (B) and incorrect answers (A, C, D)
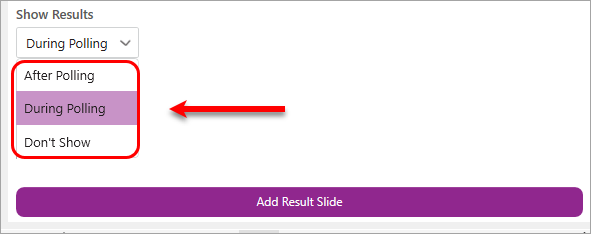
- Show Results: polling results can be shared with participants After Polling, During Polling, or Don't Show
- After Polling: students' responses will be displayed AFTER the polling question is completed/closed to move to the next question (i.e. you don't want students to be influenced by others' responses)
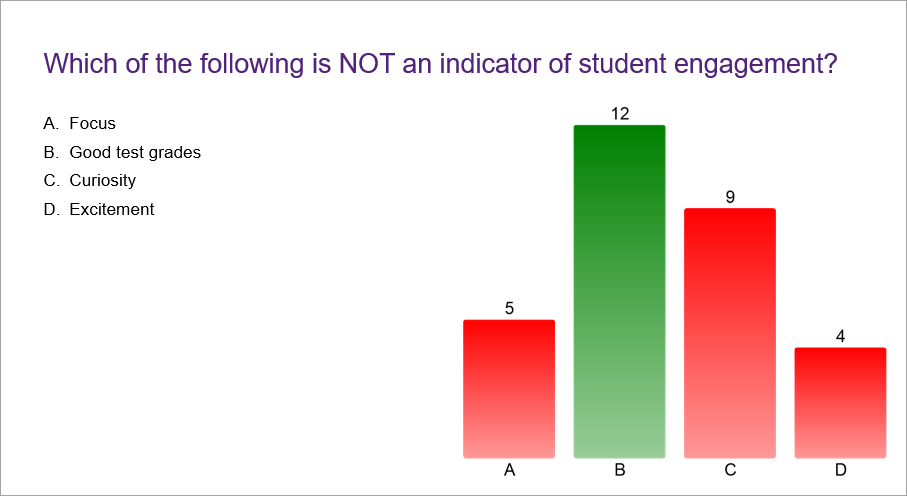
- During Polling: students' responses will be displayed LIVE on the slide (i.e. you want the poll to be exciting!)
- Don't show: students' responses will NOT be displayed LIVE on the slide (i.e. it is a 'food for thought' question and students do not need to see the class' responses)
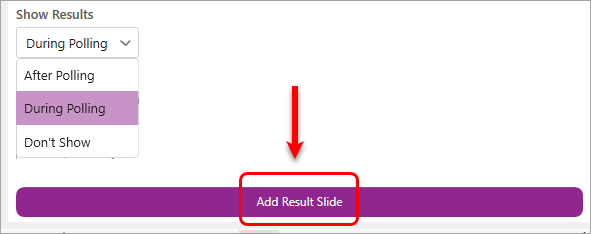
- (Not recommended) Add Result Slide setting is to add an extra slide to show the results. This result slide seems to add more complication to the PPT.
- Optionally, select the relevant chart type.
- Click on the Insert button.
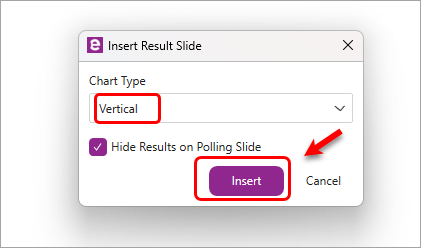
- A result slide will be added after the question slide
- During Polling: Polling results are displayed synchronously on the question slides participants answer the questions.
- Don't Show: Polling results are NOT displayed while participants answer the questions.
- Question Timer: to display the timer for participants during a polling question.
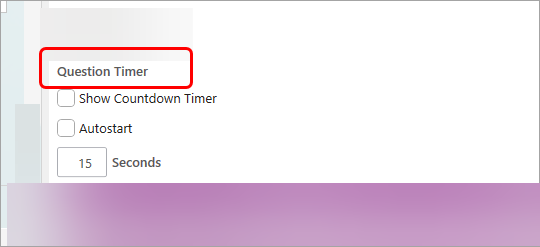
- Show Countdown Timer:
- Check the Show Countdown Timer checkbox
- Enter the relevant timing (e.g. 30)
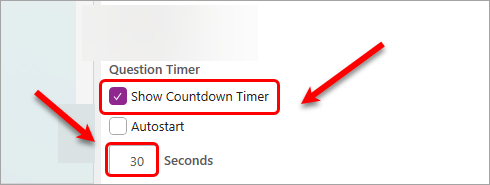
- Autostart: the countdown starts and stops automatically
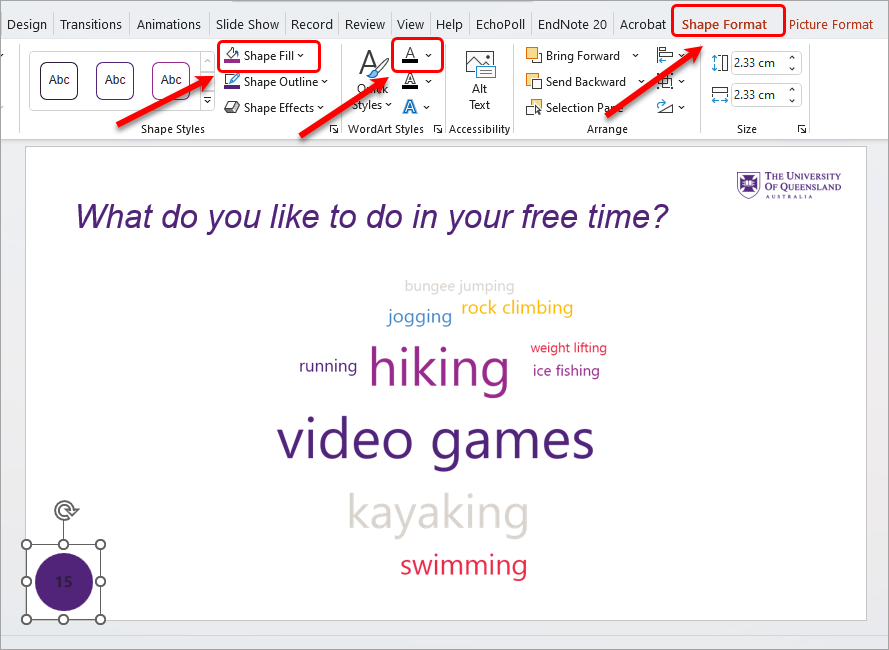
Note: The timer colour is auto-decided by the PPT template you use. You can change the colours of the Timer to improve accessibility.
- Click on the timer
- Select Shape Format on the toolbar
- Select a relevant colour from Shape Fill
- Select a relevant colour from the Text colour.
Some options can be set up in your EchoPoll account so that they are selected for all of your polling sessions. See the EchoPoll - Preference setups in your account guide for detailed instructions.