EchoPoll - Local setups in your PowerPoint (Ultra)
You can pre-select your preferred settings in a PowerPoint presentation before creating polling questions. These settings will be applied to all polling slides. If a polling question requires different settings, you can edit the settings for individual questions in your PowerPoint.
Before you do the following steps, make sure you have downloaded the EchoPoll desktop app.
- Open a new PowerPoint presentation or the one you have.
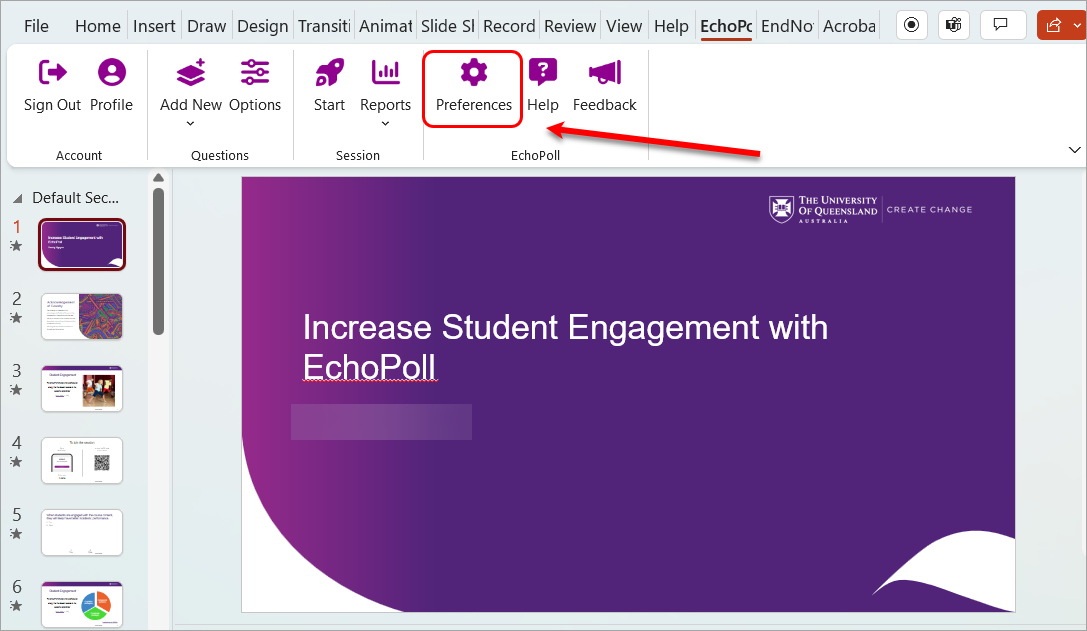
- Click on the Preferences button.
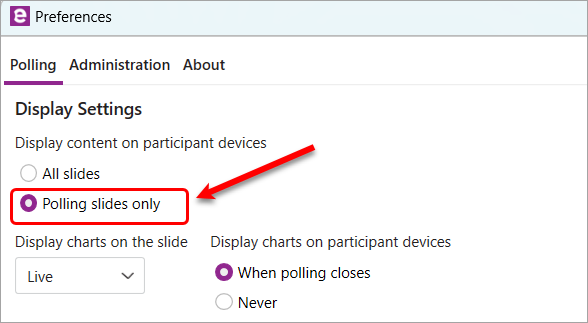
- Display settings: it is recommended to select the Polling slides only option because it will not slow down your presentation and not be distracting to students when they use their (mobile) device to only join the polling questions.
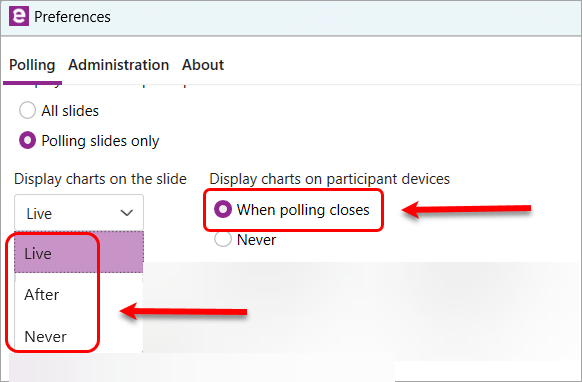
- Display charts on the slides: whether you want to display the response chart on your slide
- Live: responses are displayed WHILE the polling question is open (i.e. you want the students to see others' responses updated on the slide
- After: responses are displayed AFTER the polling question is closed (i.e. you do not want the students to be influenced by other students' responses)
- Never: responses are NOT displayed on the slide at all (i.e. you want it to be a 'food for thought' and do not want students to see the class responses)
- Display charts on participant devices: whether you want to display the response chart on students' device
- When polling closes (recommended): students will see the class responses on their devices. Note: Sometimes if you spend additional time talking about a question before moving to the next question, students might need to refresh their devices to access the next question.
- Never: students WILL NOT see the class responses on their devices.
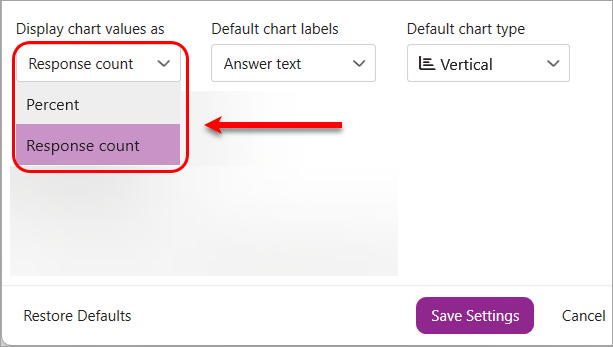
- Display chart values as: whether you want to display the responses
- In number, select Response count, or
- As percentage, select Percent.
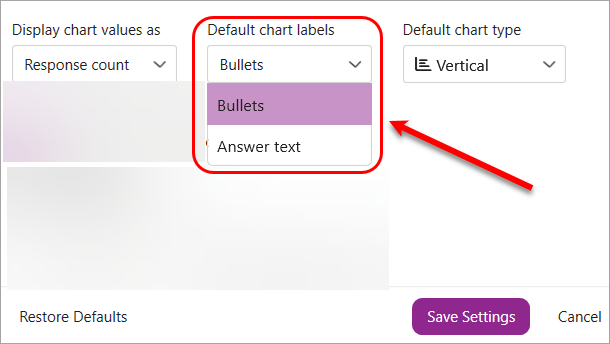
- Default chart labels: select either to display the options on the chart as
- Bullets (A, B, C) - when the option contains long phrases or sentences, or
- Answer text - when the option contains short phrases.
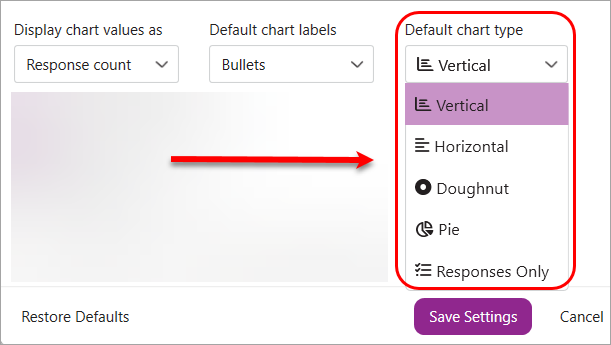
- Default chart type: select an option to display your chart (Vertical, Horizontal, Doughnut, Pie, or Responses Only).
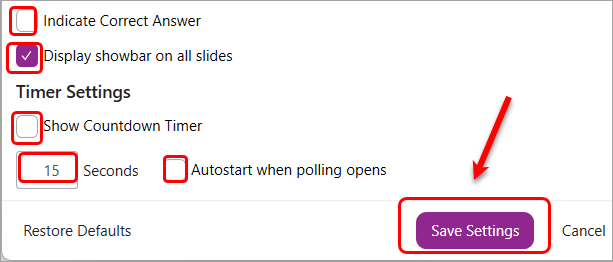
- Indicate Correct Answer: You can decide whether to enable this setting depending on your polling content.
- The setting Display showbar on all slides is enabled by default and it allows you to easily control your polling session.
- Timer Settings: You can decide whether to enable this setting depending on your polling intention.
- If you enable Show Countdown Timer, you will need to enter the number on the Seconds textbox
- The default time is 15 seconds. In reality, it might require longer timer, for example, 30 seconds for an easy MCQ question.
- The Autostart setting allows the auto start of the countdown and auto stop to the poll; i.e. you do not need to click on the screen
- Click on the Save Settings button.