Lecture Recordings - Analytics Overview (Original)
Echo360 ALP provides information and feedback regarding student engagement and course participation. Instructors can view analytics for all lecture recordings in a course which are broken down into several sections:
- Course analytics
- Student analytics
- Engagement scores
Accessing analytics
- Click on the course for which you want to view analytics.
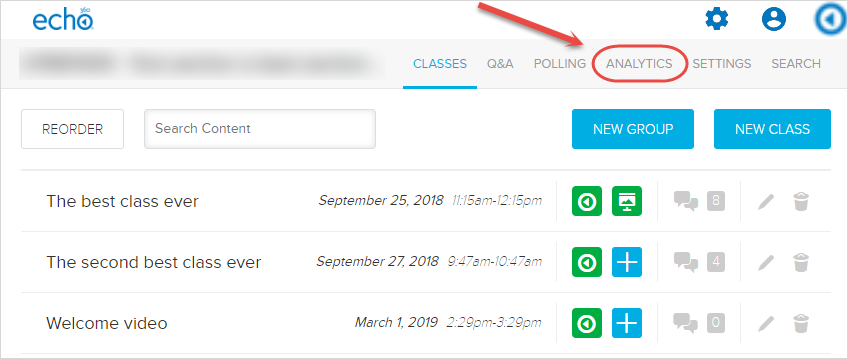
- Select the ANALYTICS tab from the menu.
Course analytics
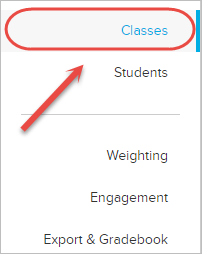
Select Classes from the menu on the Analytics page.
Note: The term "class" refers to an individual lecture recording (e.g. 8 September 2017, 4pm - 6pm).
- The graph shows student activity by lecture recording or presentation.
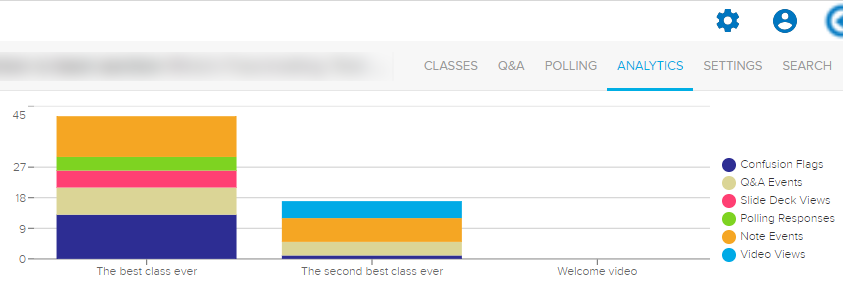
- Data categories available include:
- Confusion Flags: number of times students flag content as confusing.
- Q&A Events: number of questions and responses students post.
- Slide Deck Views: number of times students view a presentation or slide deck.
- Polling Responses: number of student polling responses.
- Note Events: number of words students write in the form of notes.
- Video Views: number of times students have viewed the video.
- Hover over a lecture recording or presentation to view all data categories for that content.

- You can also view the data categories for all lecture recordings and presentations in a table format below the graph.

Engagement score weightings
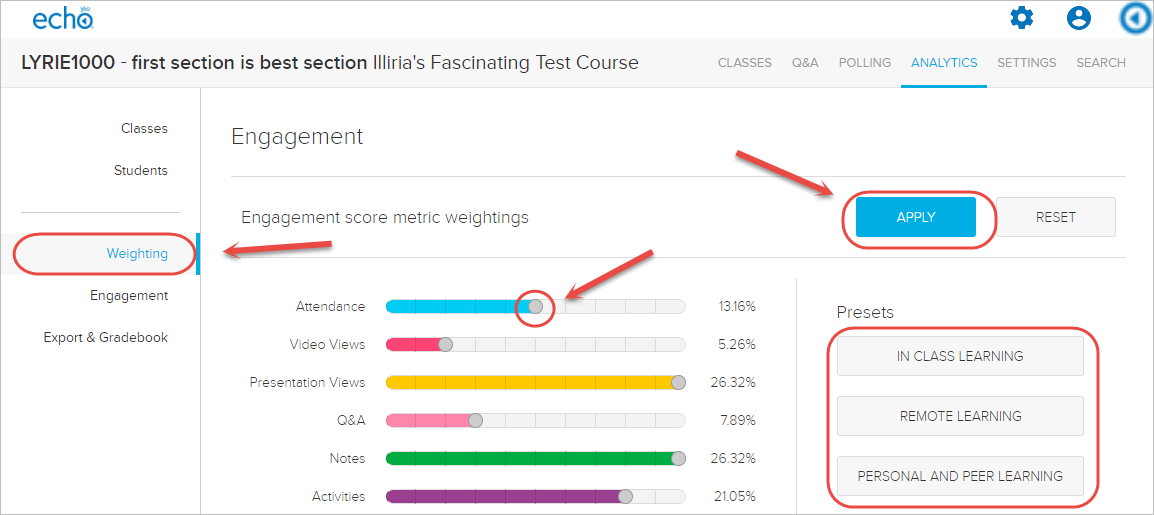
- Select Weighting from the menu on the Analytics page.
- By default, all of the engagement metrics are evenly weighted. You have the following customization options:
- Change the default settings by sliding the end of each metric's bar to the right or left to increase or decrease the importance of that metric.
- Select one of the Presets provided.
- Do both by selecting a Preset, then customize it by moving the slider to the right or left as appropriate.
Note: All metrics add up to 100%: The "weight" of each metric is a portion of 100% - meaning if you increase one metric, the rest of the metrics must decrease by a corresponding amount. This is reflected in the percentages shown for each metric to the right of the slider.
- Click APPLY to apply these settings to this course.
- Click RESET to return the metrics to their original (or last saved) settings.
Refer to the Using Weighting to make Engagement Equal to a Single Metric (Echo360) guide for further information.
Engagement scores
The student engagement score scales student performance based on the weight you establish for each of the analytic metrics.
Note: Engagement scores must be set for each section. All metrics are evenly weighted by default.
- Select Engagement from the menu on the Analytics page.
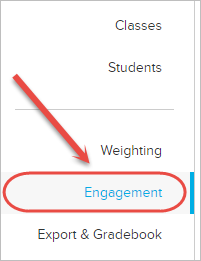
- By default you will initially view overall engagement information for all classes.
- Select a class from the All Classes drop-down list to filter engagement information for a particular lecture recording or presentation.
- You will be be able to view a list of the least engaged students based on your filter choice.
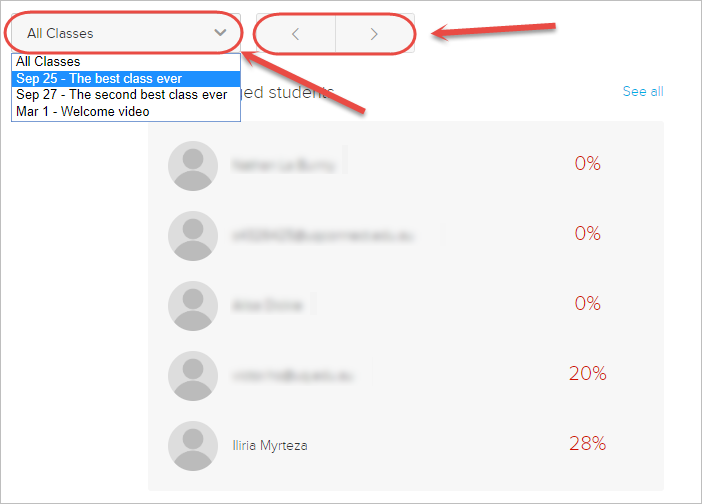
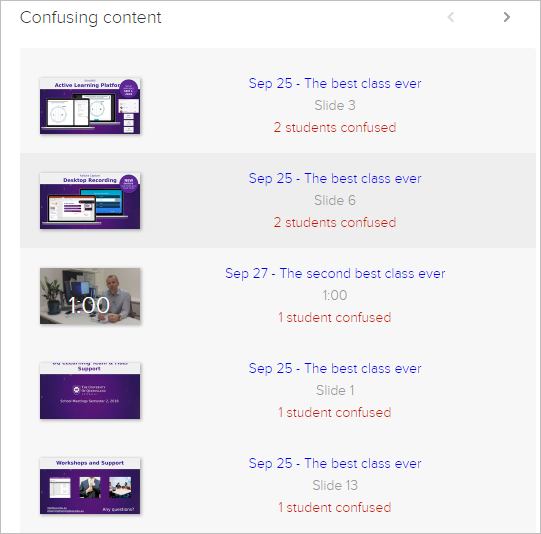
- You can also view points where students have marked that they are confused based on your filter choice.
Student analytics
- Select Students from the menu on the Analytics page.
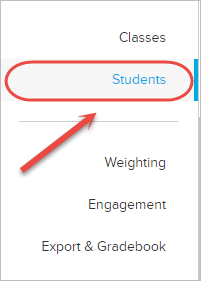
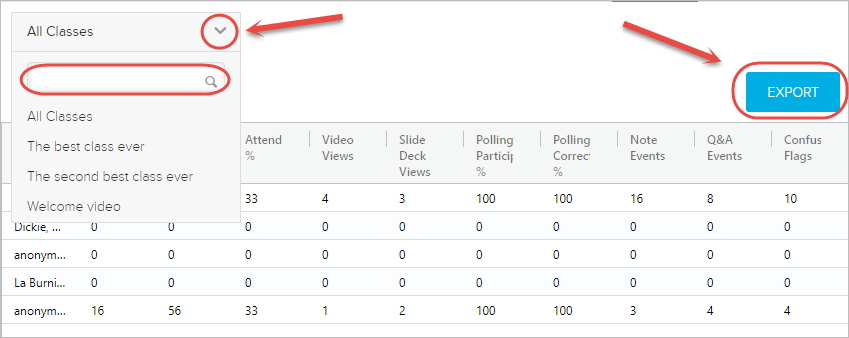
- You can view student engagement information for all lecture recordings or:
- View student information for a particular course using the All Classes drop-down list.
- Use the search box to find a particular student.
- Click on the Export button to export the current table content as an excel spreadsheet.
Downloading analytic data
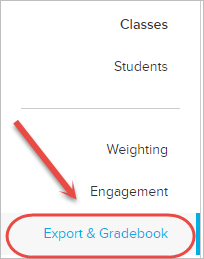
- Select Export & Gradebook from the menu on the Analytics page.
- Use the drop-down list to select which metric you want to download to a CSV file.
- Click on the START EXPORT JOB button.
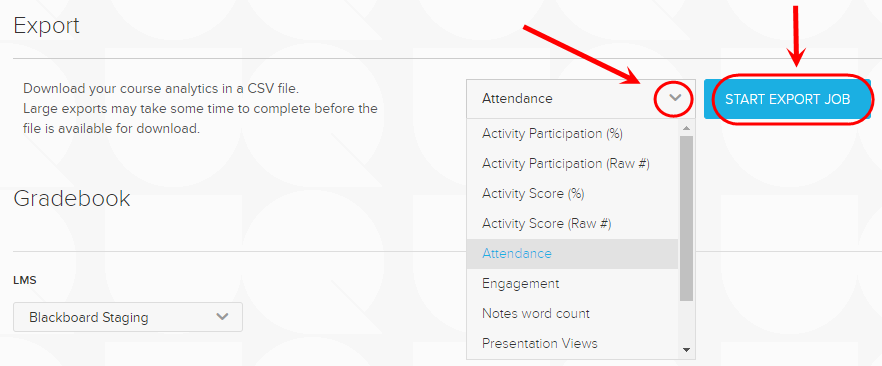
Note: You can choose multiple report options to download.
- Click the Download link next to each export type to download the file.
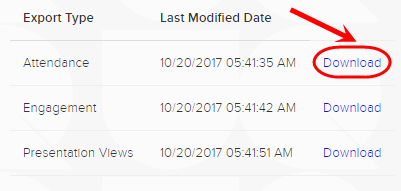
Note: You may have to refresh the page to see the Download link.
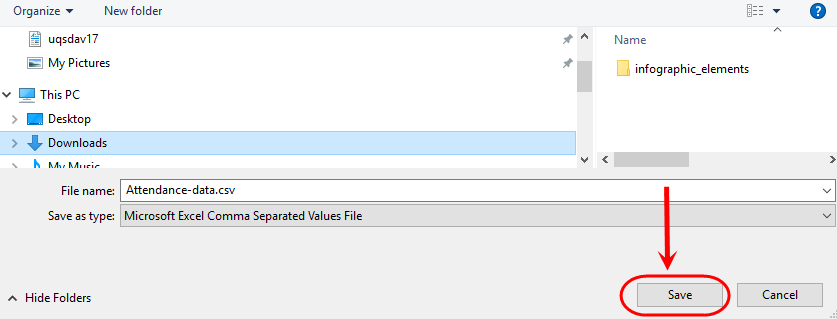
- Save your CSV file in an appropriate location.
- Click on the Save button.
- Click on the downloadable file to view the spreadsheet.

Note: Each time you initiate a new export of that metric, the old file is overwritten by the new one.
