Insights channel in course team (Original)
Insights in Microsoft Teams uses at-a-glance data views to help teaching staff track their students’ Teams activity, such as engagement in class conversations. The spotlighted data points and visualisations inform teaching staff on trends in student activity in a course team.
Insights is available automatically as a tab in your course team. Adding the Insights to your app bar provides an overview page of all your courses.
Below are some examples of the analytics in a course team.
Course team analytics
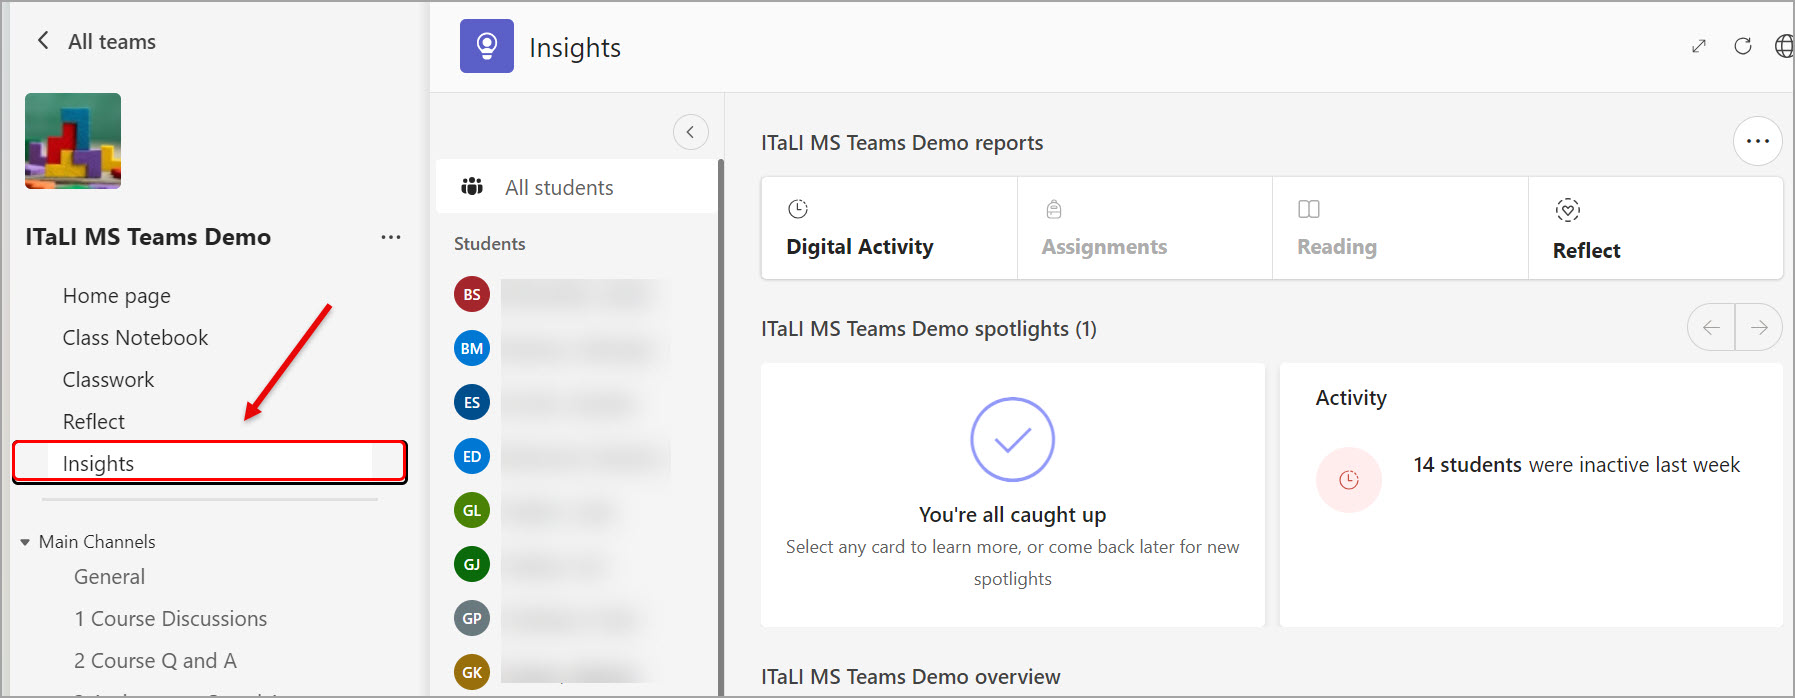
- Click on the Insights channel in your course team.
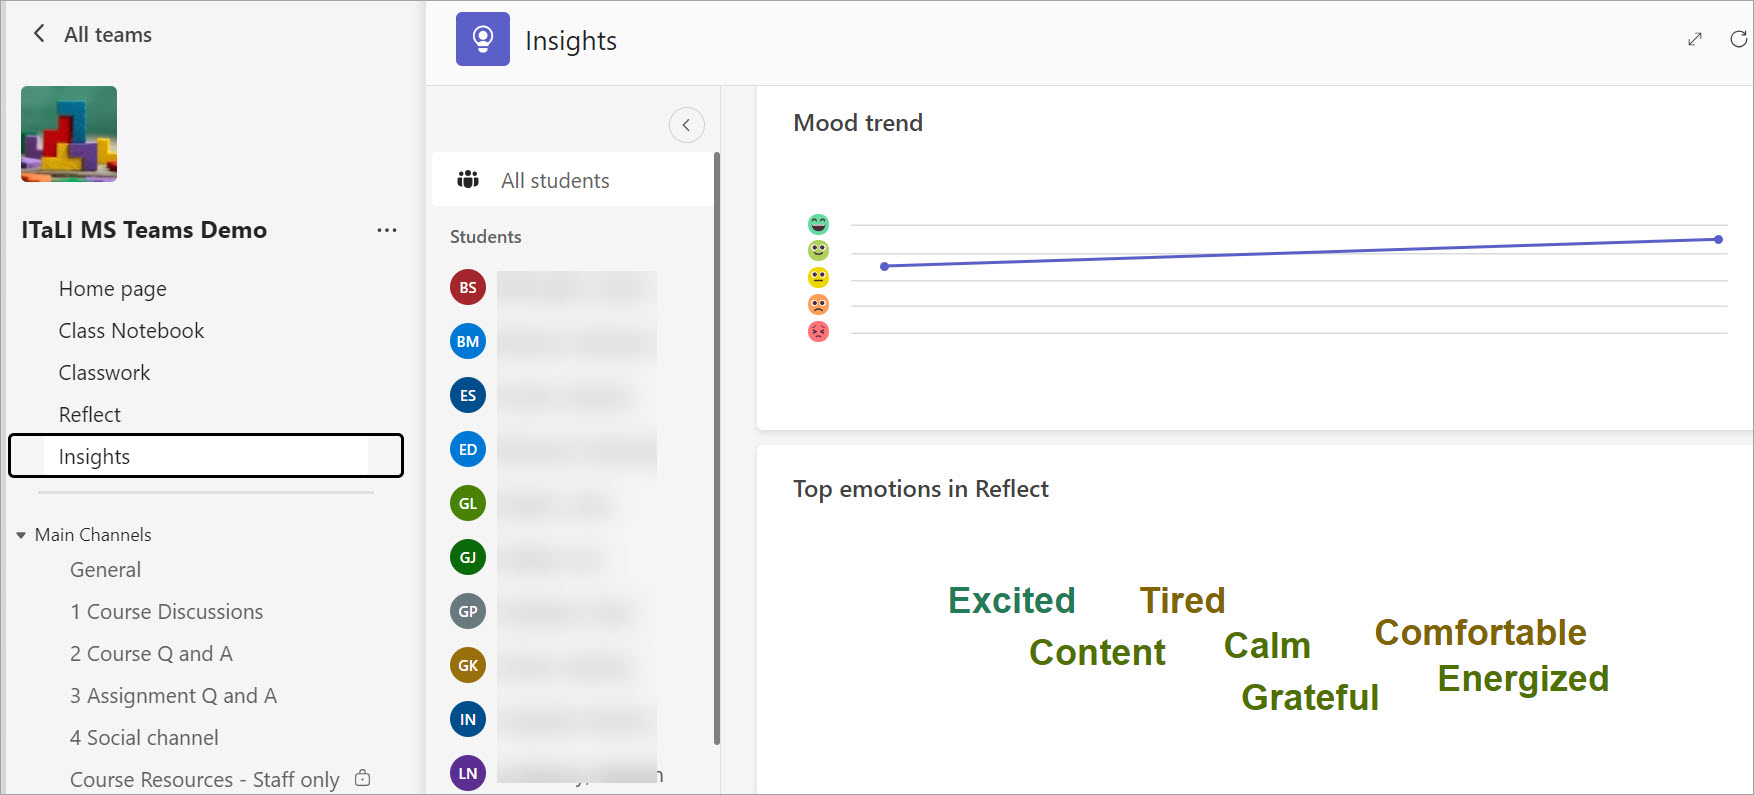
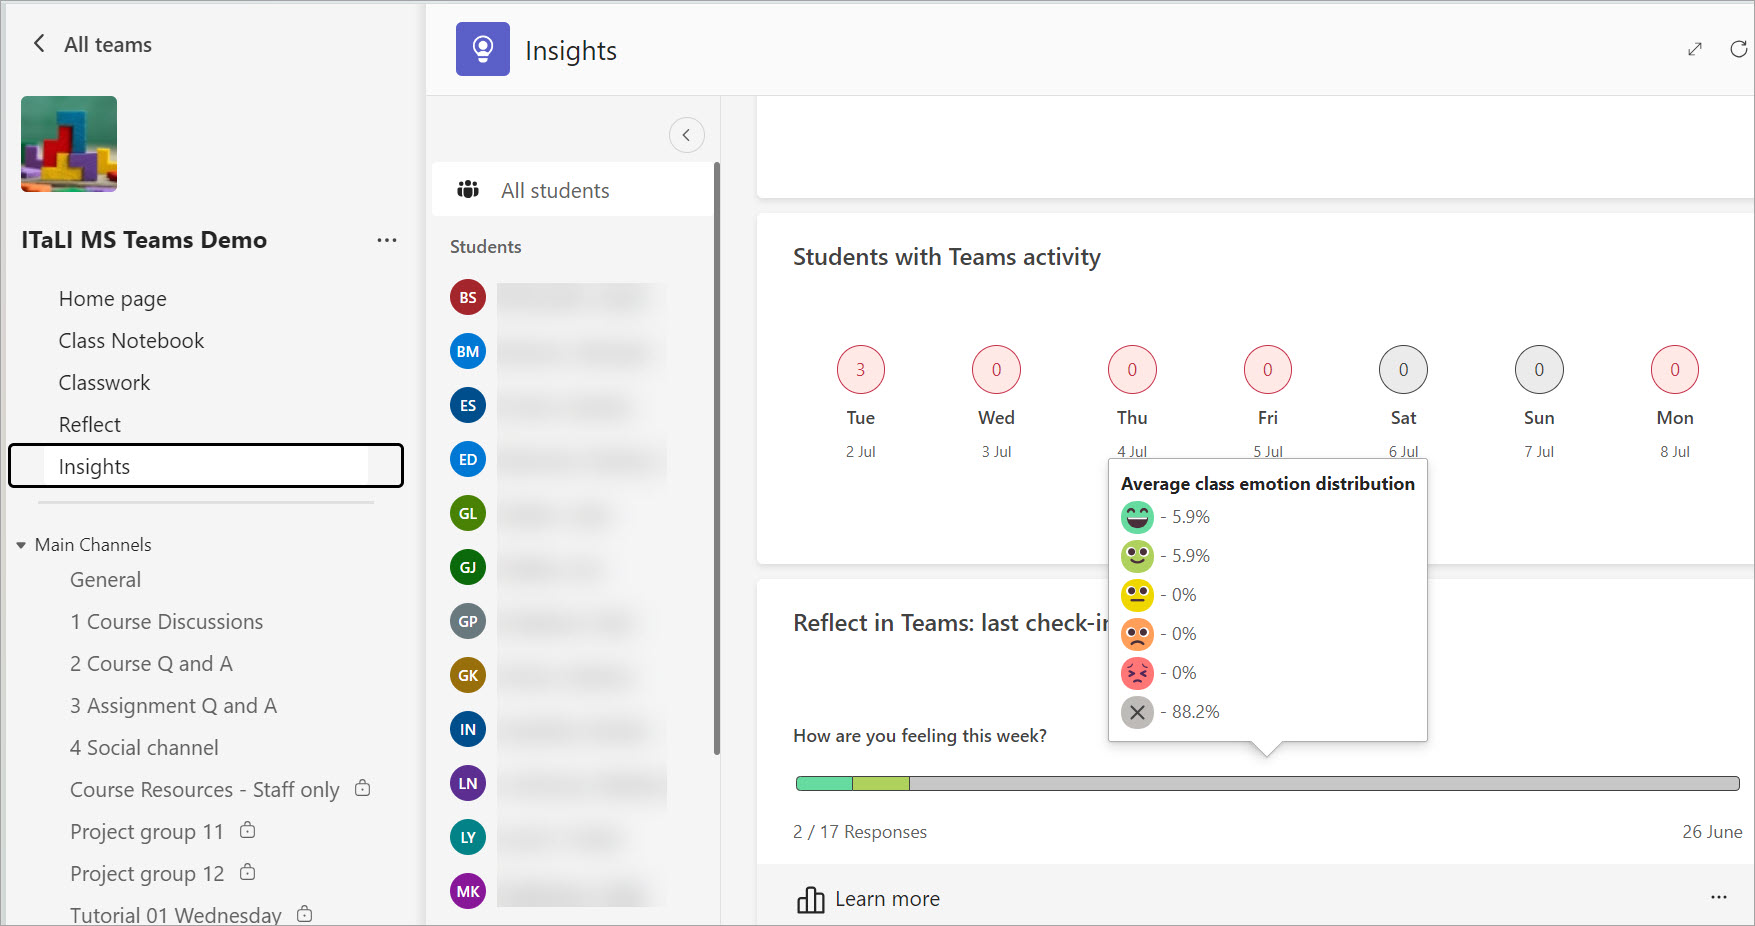
- Scroll down and the analytics on Mood trend is displayed.
Note: You need to create a check-in activity for students, using the Reflect channel to have analytics on the mood trend.
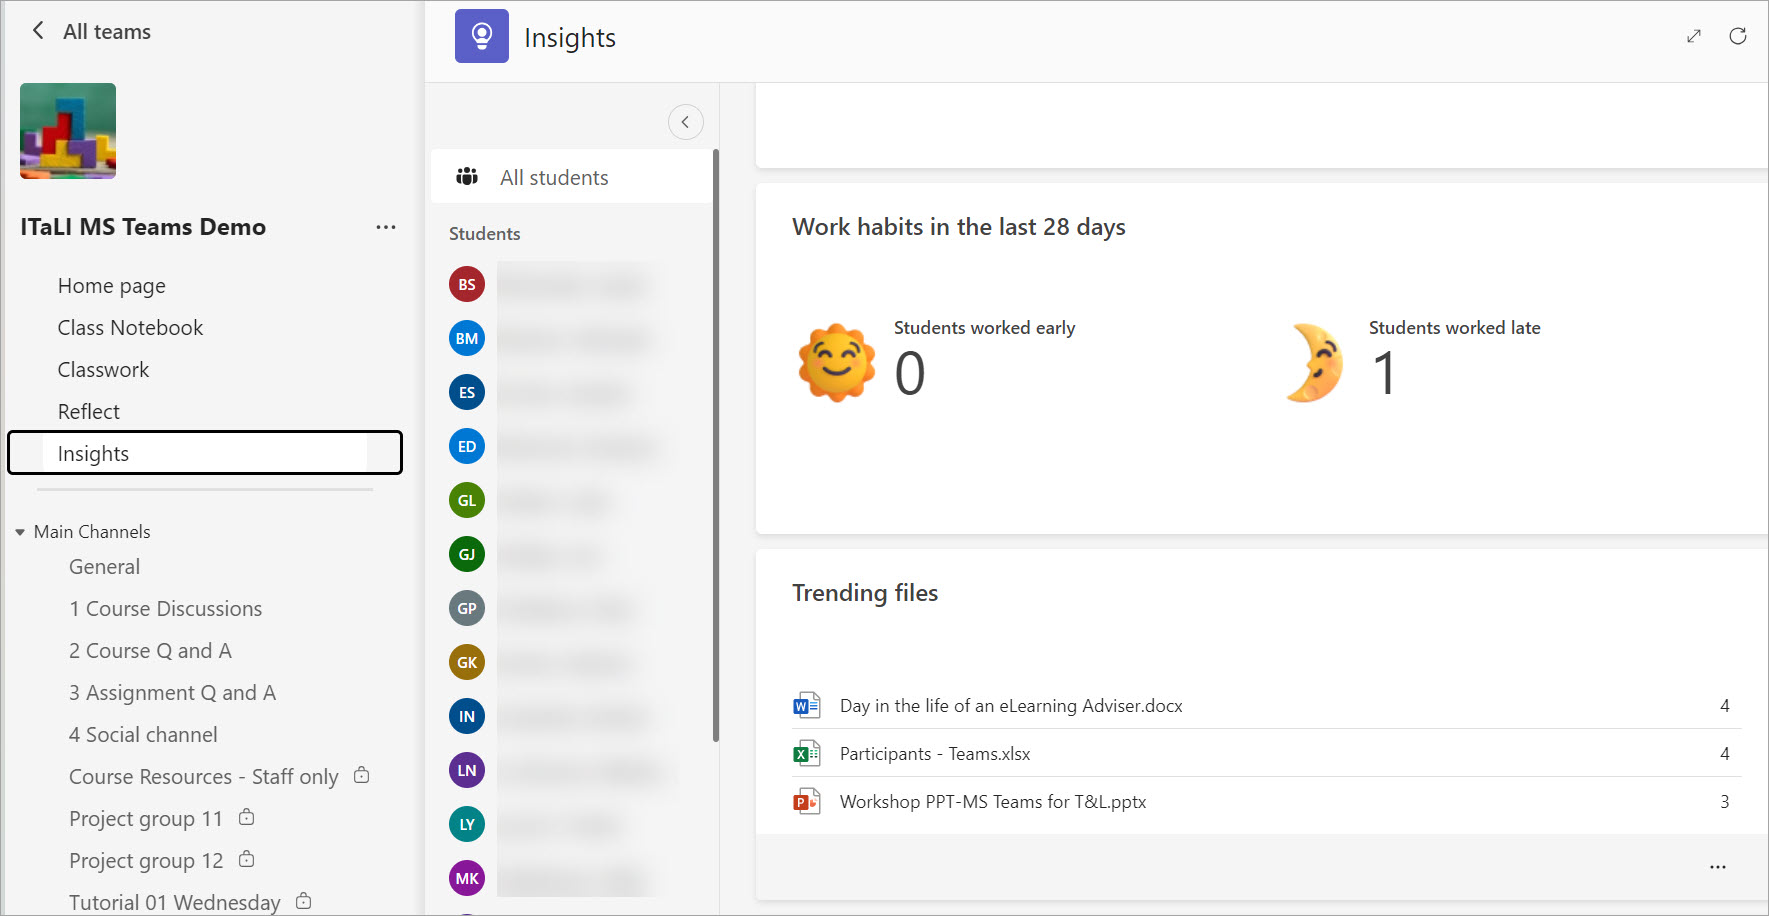
- Scroll down and the analytics on Work habits is displayed.
- The Trending files displays the number of clicks on the files uploaded in your course team.
- Aggregated analytics on Students with Teams activity and Reflect in Teams are displayed.
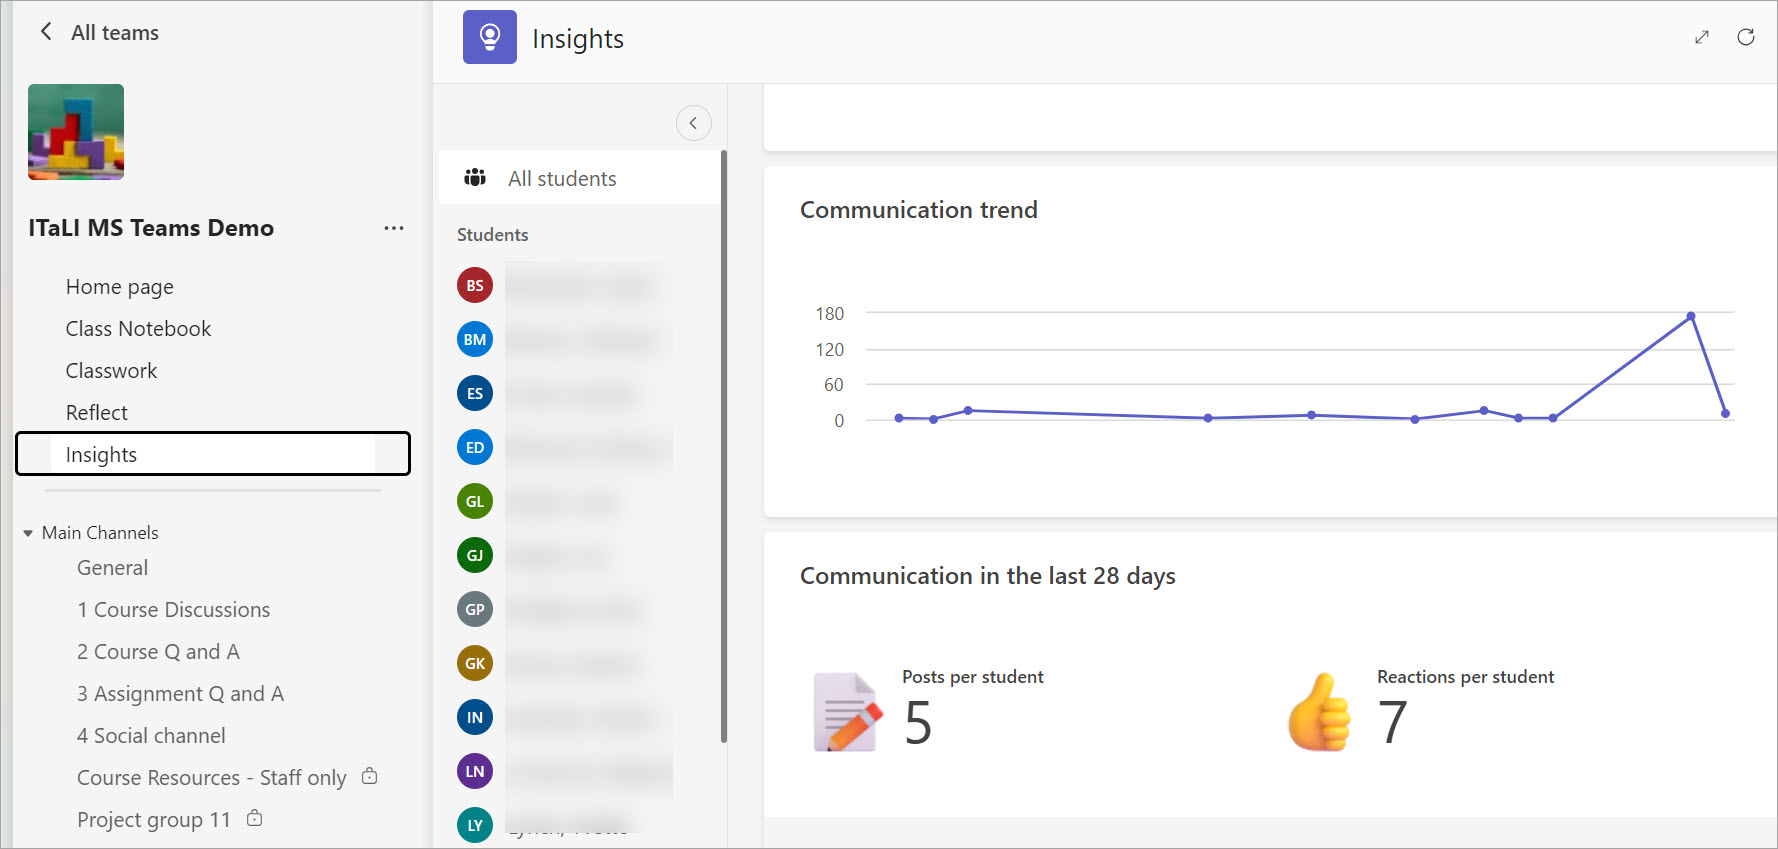
- The Communication Trend analytics show the graphic on communication which also breaks down to students' posts and reactions.
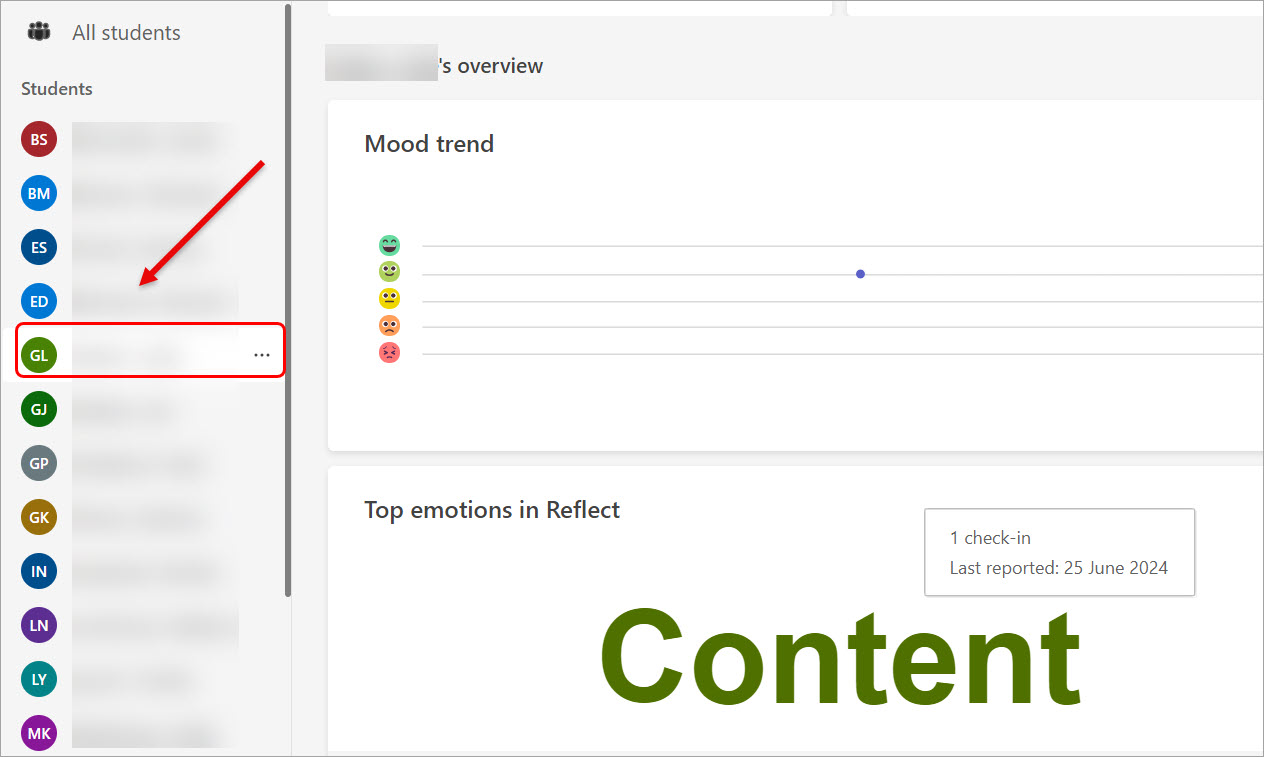
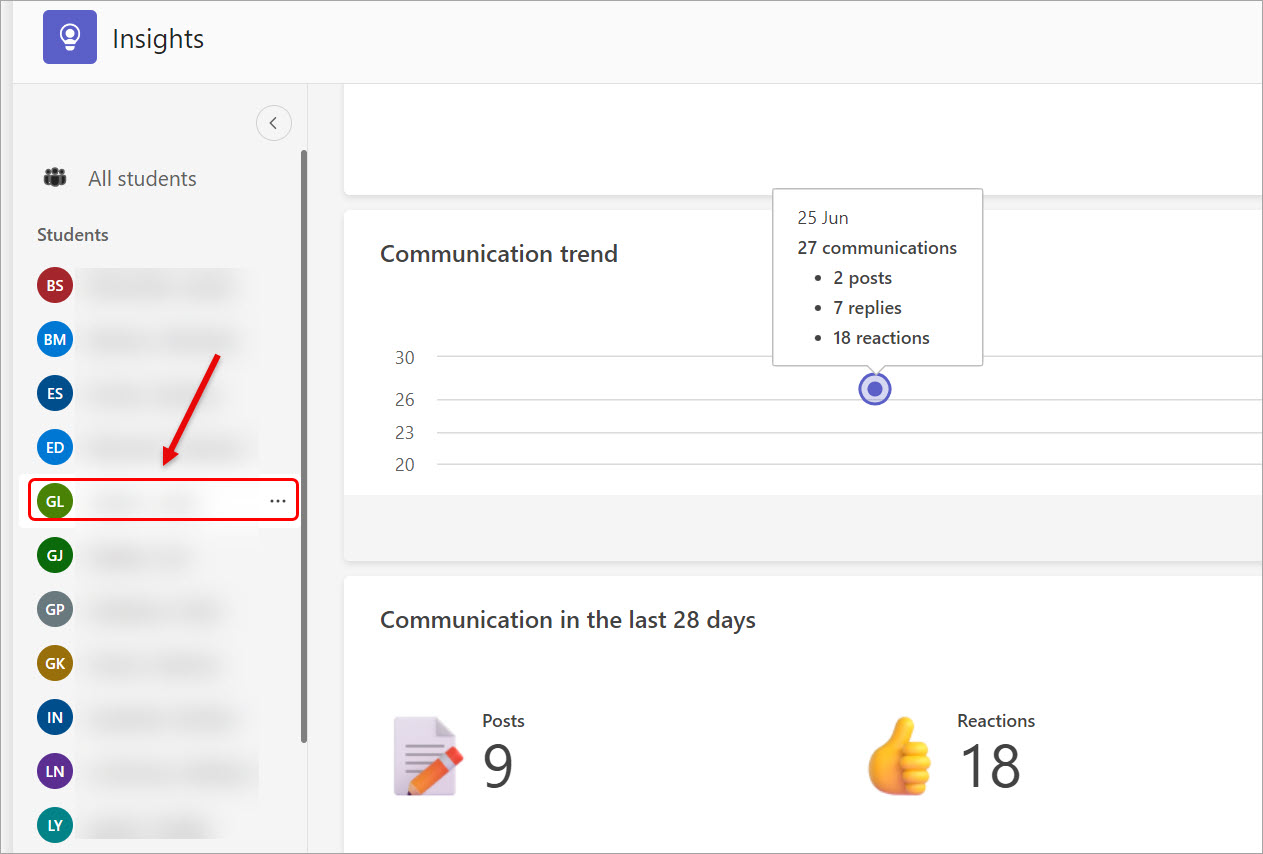
Individual students' analytics
- Click on a student's name. The analytics on the student's mood trend and communication analytics will be displayed.