Course Insights - Getting Started (Ultra)
Video Guide
Course Insights - Quick start guide (YouTube, 5m 5s)
Course Insights Menu
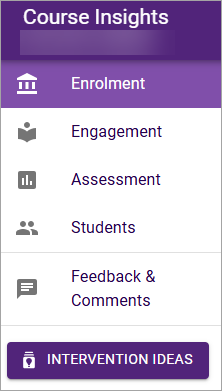
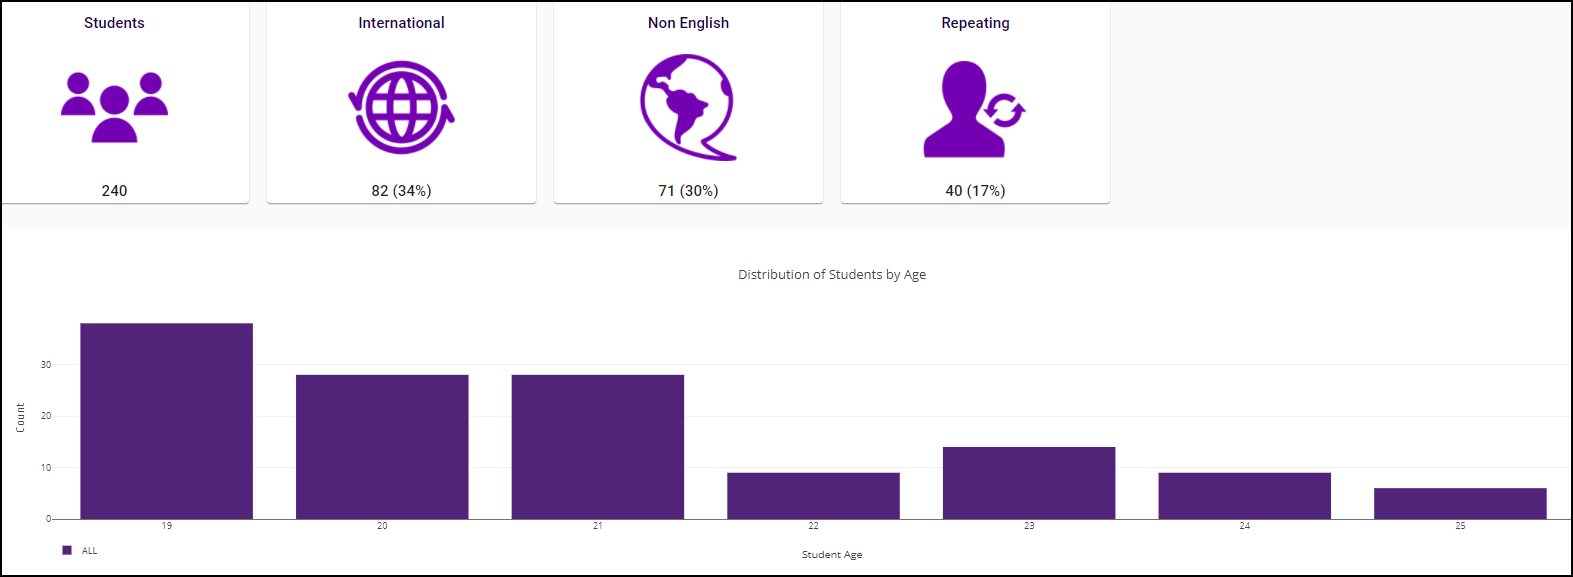
Enrolment: This section provides an overview of the overall course and filtered cohort’s demographics.
Engagement: This section primarily uses data from the edX edge and Blackboard Learn platforms to provide an overview of the engagement level for students and cohorts.
Assessment: This section primarily uses data from the Blackboard Grade Centre items to provide an overview of how students are performing or engaging with the course.
Students: This section displays student level overview information that can be filtered to display the desired cohort.
Feedback & Comments: In this section, staff can provide feedback and comments on suggested improvements to the interface, report any confusing wording or analytics they don't understand. Staff are also encouraged to provide specific examples of use cases, such as a particular filter they have chosen and how they will use those filtered results.
Intervention ideas: This section includes all the intervention activities developed along a course lifecycle that staff can use in their course. When a particular stage in a course is selected, such as 'Before Orientation Week' or 'Before Quiz/Exam/Assessment,' suitable activities will be presented.
Graphs
Zoom in on a graph
- Click and drag your mouse over the area of the graph that you want to zoom in on.

- The graph will then show that section in a zoomed in view.
Save a graph
- Hover over the graph that you want to save as an image.
- Click on the camera button in the top right-hand corner.

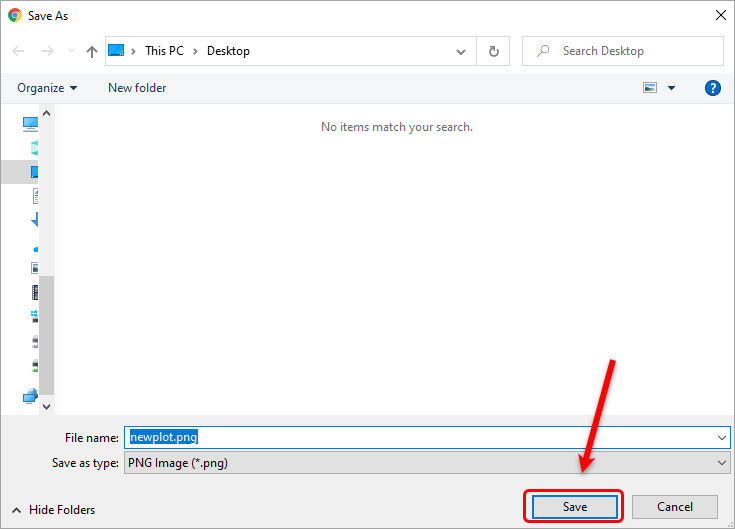
- This will prompt you to save the image of the current graph as a PNG file.
- Choose your desired location and click on the Save button.
5. Double click to zoom back out.