Course Insights - Assessment section (Original)
Overview
The Assessment section has been designed to provide course coordinators and teaching staff with an overview of the course assessment, as well as a detailed breakdown of all assessment tasks.
Insights to Investigate
- Which students did not perform well in an assessment task?
- Which assessment tasks did students achieve poor results?
- Which assessment tasks did students struggle with?
Assessment Flow
When accessing the Assessment section, all assessment items will be displayed.
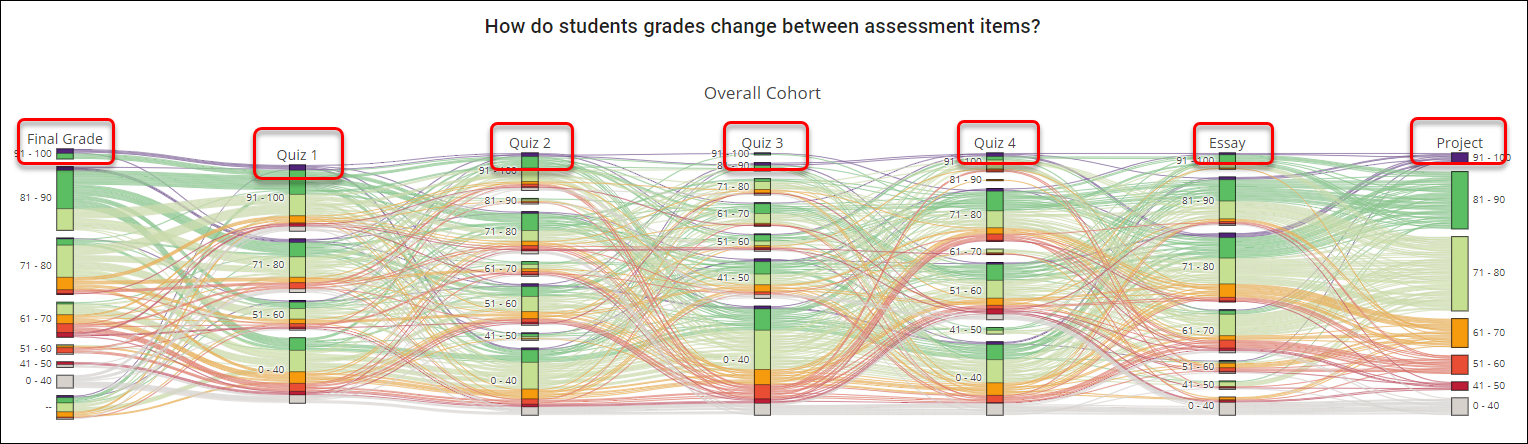
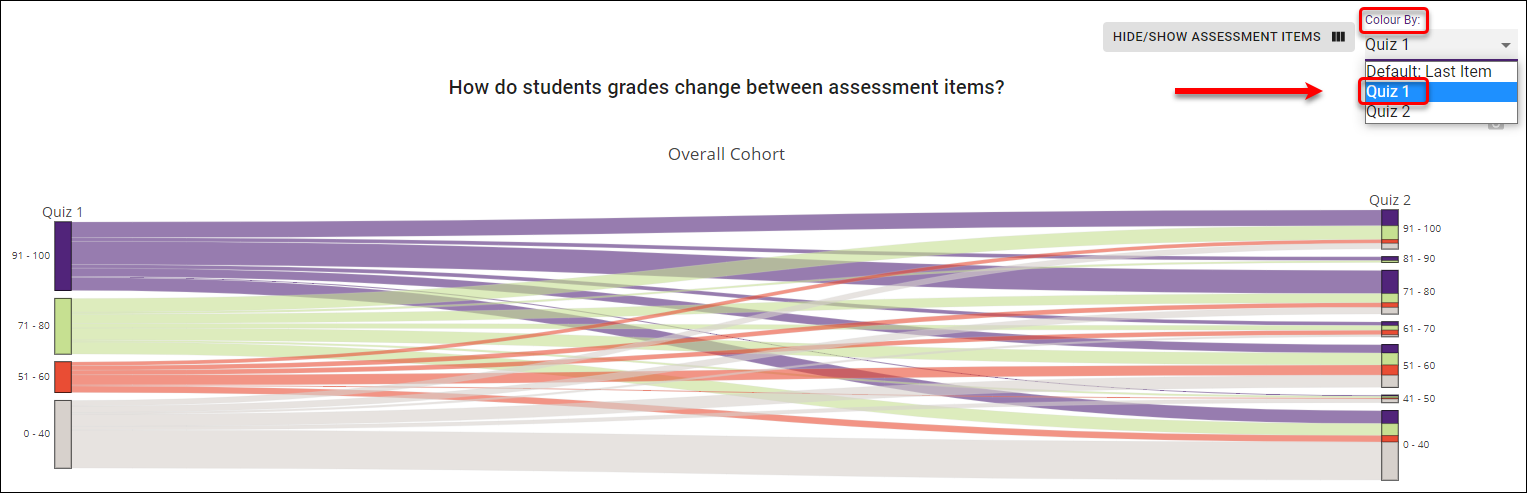
The assessment sankey shows how student grades change between assessment items.
Hide columns
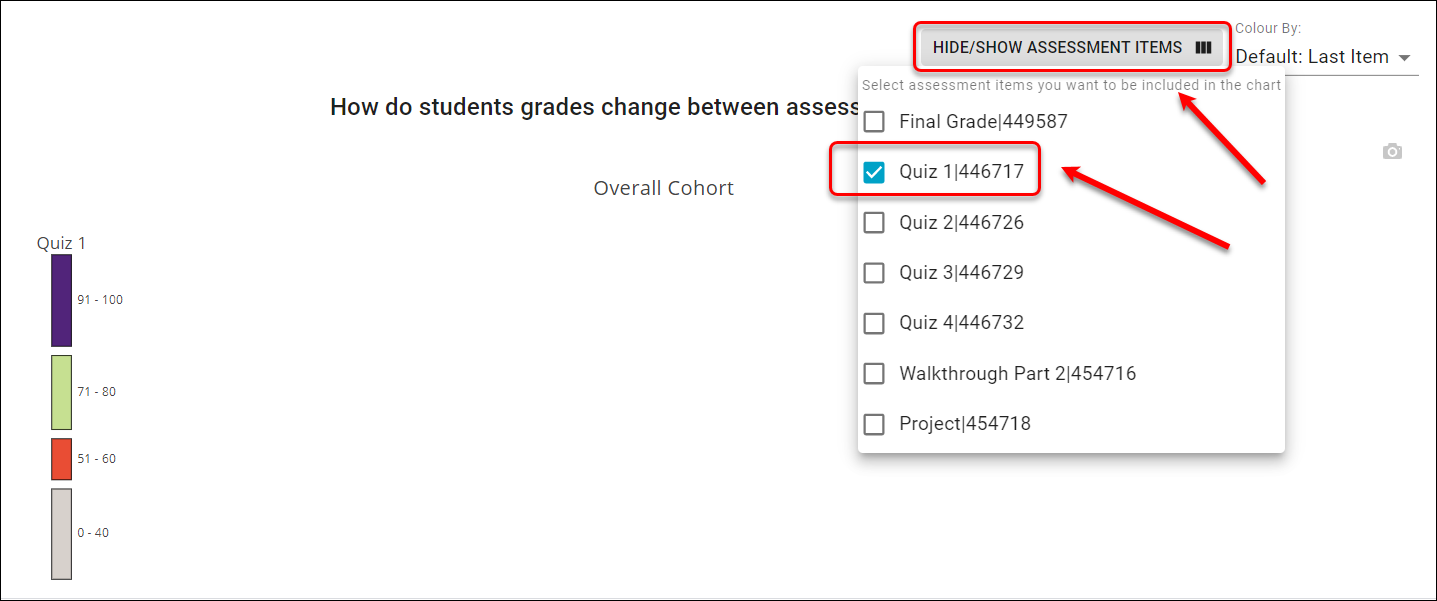
Investigating one assessment item
- Click on the HIDE/SHOW ASSESSMENT ITEMS button.
- Uncheck that boxes for assessment item columns that you wish to temporarily hide on the graph.
- To show the assessment item column again, simply recheck the required checkbox.
- Hove the mouse over the grade brakes to see the number of students for each brakes.
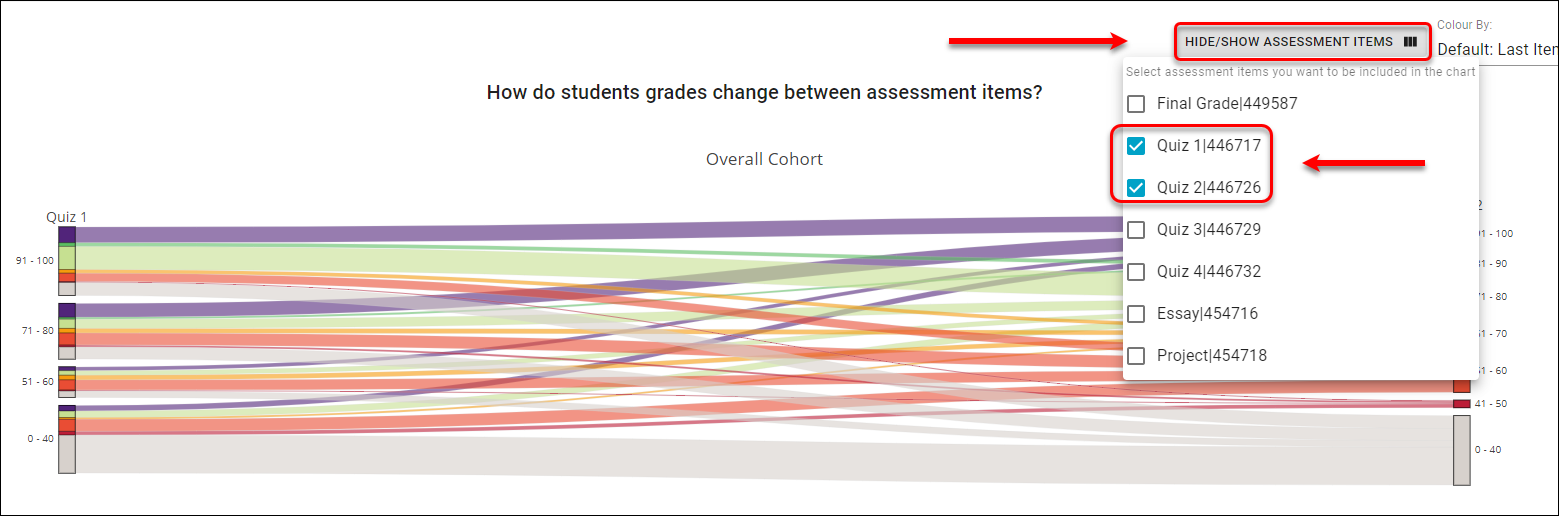
Comparing different assessment items
- Click on the HIDE/SHOW ASSESSMENT ITEMS button.
- Select the appropriate assessment items.
- Click away the box to view the results.
Change which assessment item the graph is coloured by
From the Colour by dropdown list, select a column to use to colour the student paths, usually the first one.
The colour of the chart will change accordingly, showing the trends in students' results, i.e improving or deteriorating
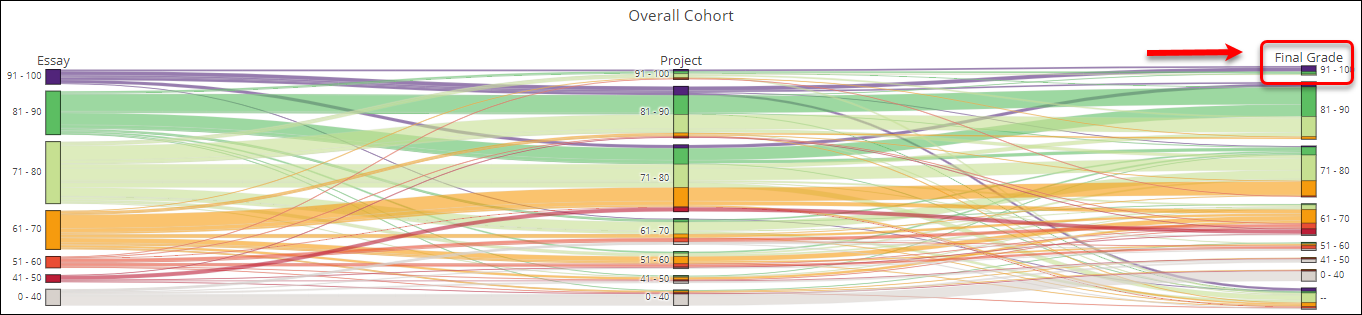
Reorder columns
Click and drag the assessment item titles to change the column order on the graph.
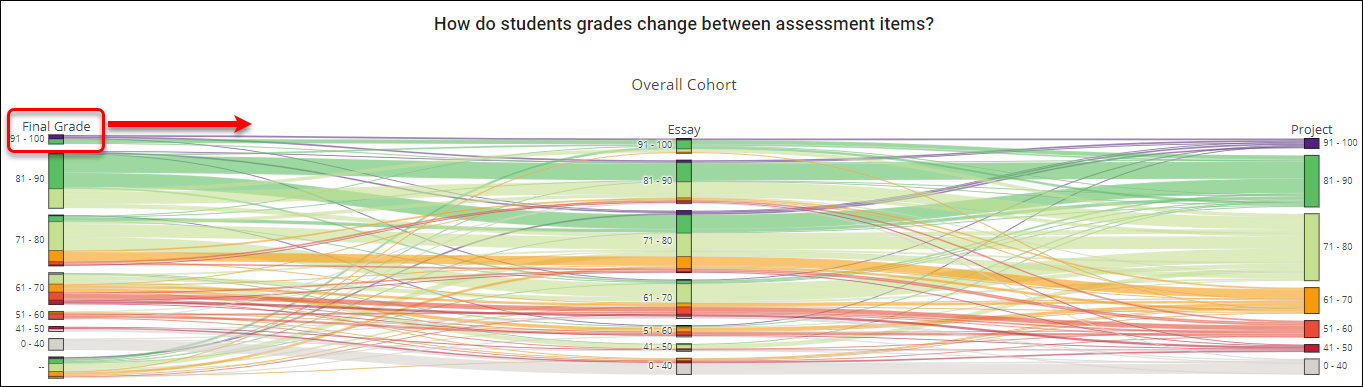
The Final Grade column should be moved to the far right to show the students' overall assessment performance.
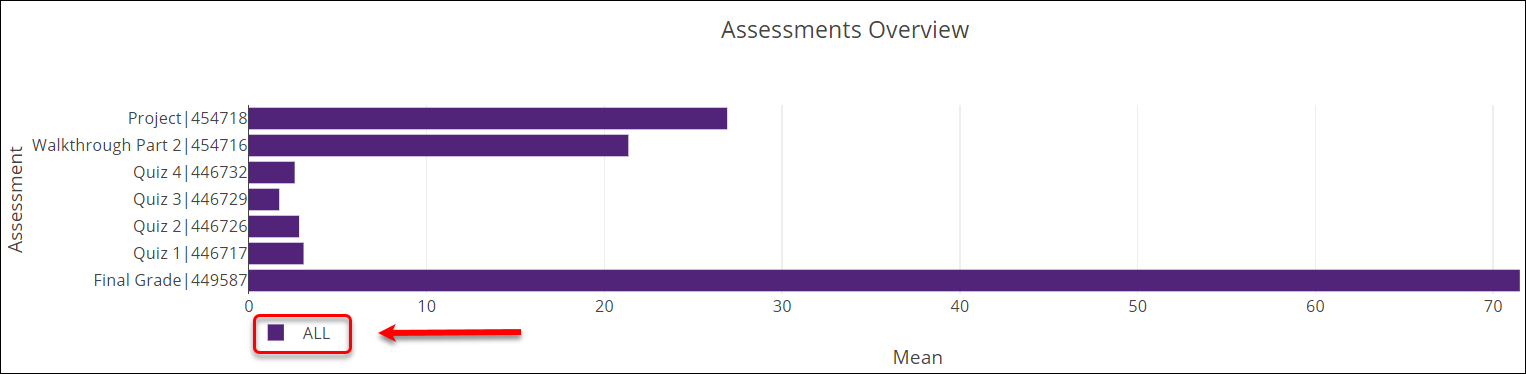
Assessment Overview
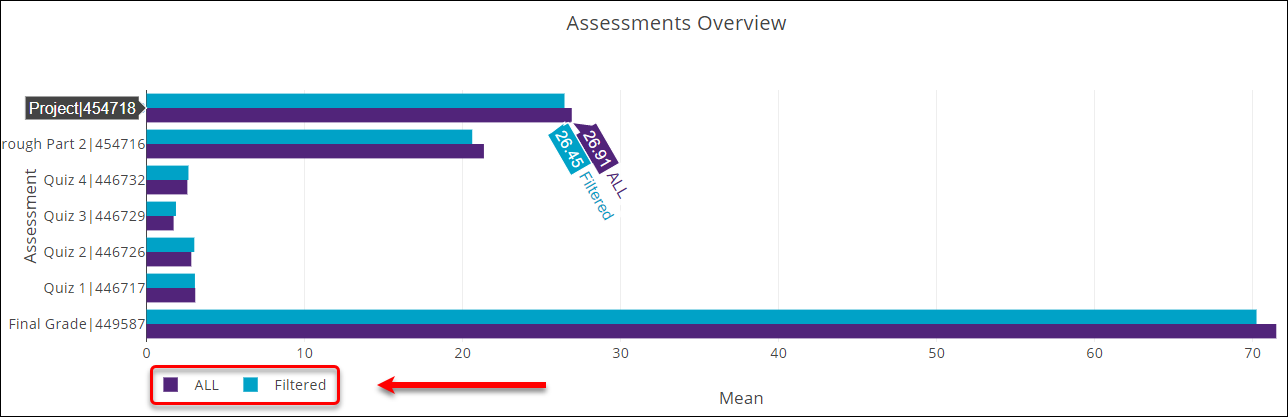
The assessment overview graph provides a filtered or unfiltered view of all assessment items based on the mean student result.
Unfiltered view
Filtered view
When adding a filter, for example, the international cohort, the Assessment Overview will provide the filtered view
Assessment Items
Filtered or unfiltered views of assessment items (mapped from the Blackboard Grade Centre) provide an overview of student performance and may be used to identify student groups that are finding difficulties with content or learning.
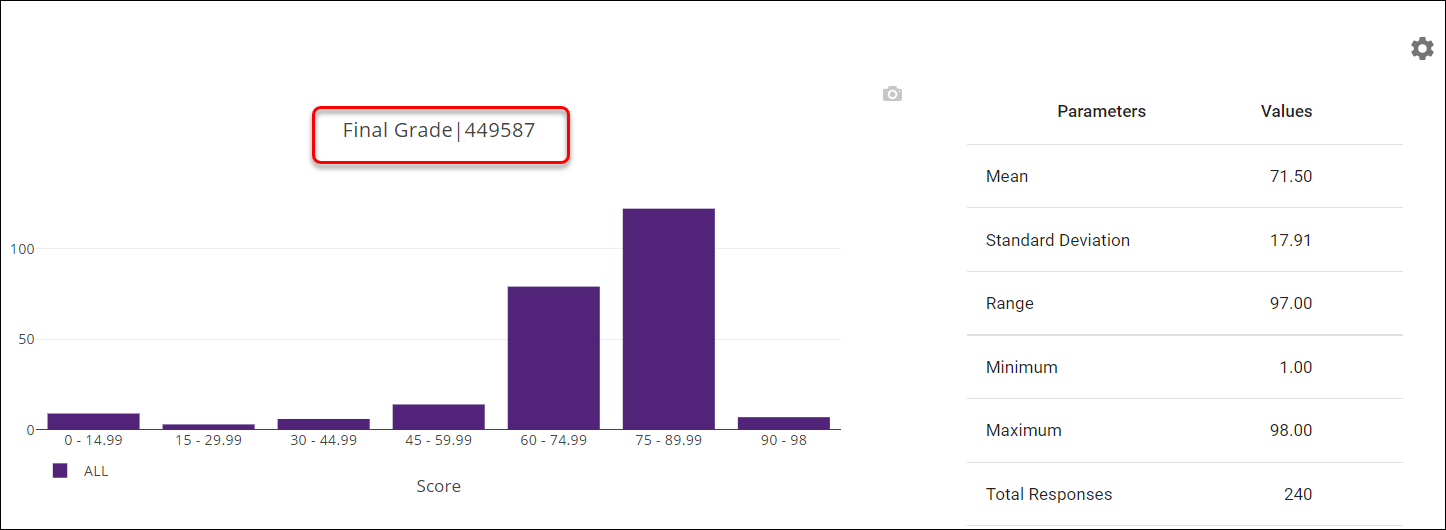
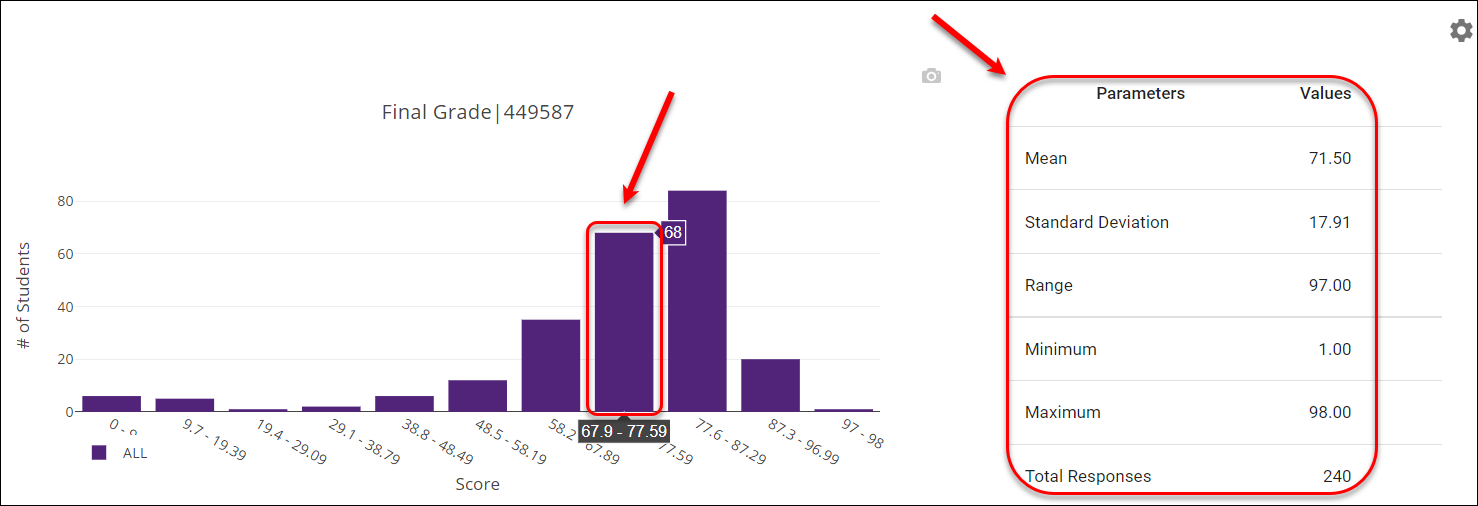
Unfiltered View
- Hover your mouse over a particular score group to view a more detailed breakdown.
- To the right of the graph, a table will display a range of parameters including:
- Mean: The average student result.
- Standard Deviation: The measure of how spread out student results are.
- Range: The difference between the lowest and highest student result.
- Minimum: The lowest student result.
- Maximum: The highest student result.
- Total Responses: The total number of student submissions.
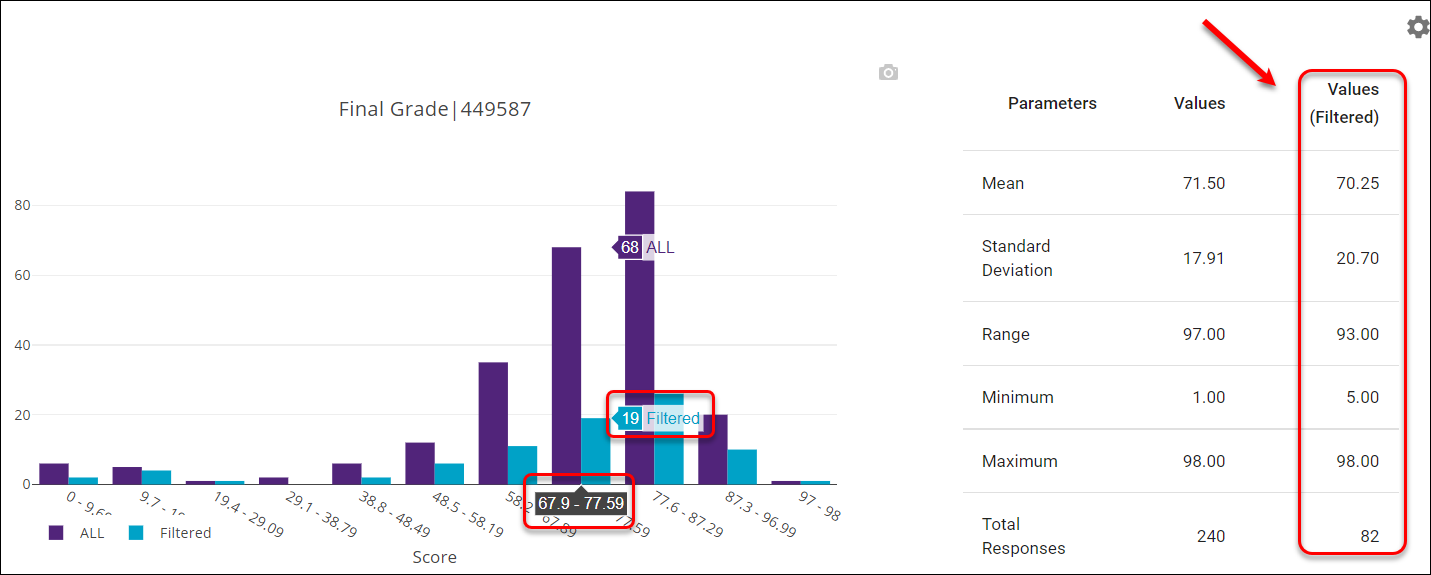
Filtered View
- Hover your mouse over a particular score group to view a more detailed breakdown.
- If a filter has been applied, information about that filtered group will appear in addition to the information about all students.
- Another column titled Values (Filtered) will also be added to the table based on the current filter.
Change Score Intervals
This is the report of Final Grade
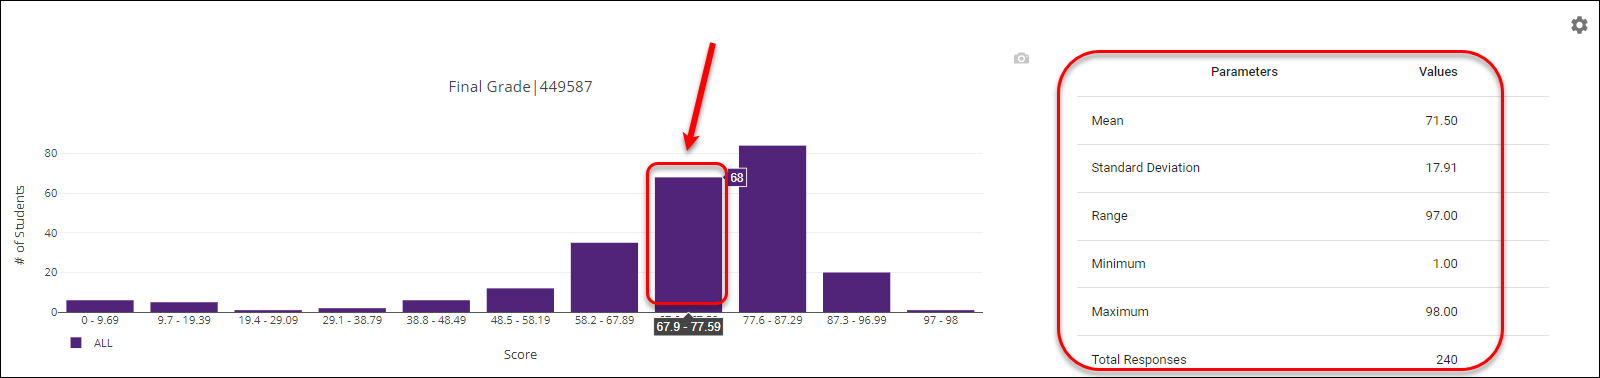
You can change the interval by
Click on the Settings cog, to change the score intervals for that particular assessment item on the graph.

The current interval is displayed

- Enter a new parameter in the Interval textbox.

- Click on the UPDATE ASSESSMENT DATA button to view the changes.